
Microstructure evolution in laser powder bed fusion-built Fe-Mn-Si shape memory alloy
 0
0
Abstract
The need for specialty powder composition limits the processing of a wide range of alloy products via the laser powder bed fusion (LPBF) technique. This work extends the adaptability of the LPBF technique by fabricating the first-ever Fe-30Mn-6Si (wt.%) product for potential use as a biodegradable shape memory alloy (SMA). Different LPBF processing parameters were assessed by varying the laser power, scan speed, and the laser re-scan strategy to achieve a fully dense part. The microstructure was found to respond to the processing conditions. For example, the microstructure of the parts produced by the high linear energy density (LED) had a columnar and strong crystallographic texture, while in the low LED, the parts were almost equiaxed and had a weak texture. To explain the evolved microstructure, the thermal history of the LPBF products was computed using the finite element analysis (FEA) of the melt pool gathered from a single-track laser scan experiment. The FEA results showed a varying temperature gradient, cooling and solidification rates, and temperature profile as a function of LED. Then, the relationship of hardness between grain size, phases present, and crystallographic misorientation of the LPBF-built alloy was analysed with reference to a control alloy of similar composition but prepared by arc melting. This study validates the LPBF processability of Fe-Mn-Si SMA and provides a new insight into the influence of processing parameters on the formed microstructure and hardness.
Keywords
INTRODUCTION
Extensive research has been carried out on Fe-Mn-Si-based shape memory alloys (SMAs) since their first development in the 1980s[1]. Similarities with steels in terms of their compositions and production routes provide confidence for researchers in the quest for commercial applications[2]; these alloys are now finding their way into structural applications. Being more inexpensive than NiTi, the Fe-based and Cu-based SMAs were identified as viable options for applications requiring shape memory and pseudoelasticity[3]. For implant applications, the Fe-based SMAs, in particular, the Fe-Mn-Si alloy, are widely considered because it consists of essential and non-toxic elements[4-10], and was even reported to be biocompatible and noncytotoxic in vivo[11,12]. Therefore, there is a continuing investigation into its shape memory and biodegradable behaviour for implant applications[13-18].
Biodegradable implants have attractive properties because they can safely degrade to their elemental constituents over time, thus eliminating post-surgery removal. With this function in mind, the alloy composition would then be limited to biocompatible elements. A recent review of biodegradable SMAs identified Mg-Sc, Fe-Mn-Si, Fe-Pd, and Fe-Pt alloys as potential candidates[19], but the Fe-Mn-Si system is advantageous because of its widely available raw materials.
In contrast to the copious literature on conventionally processed Fe-based SMAs, research on the additive manufacturing of this alloy system is in its infancy[20-27]. To the best of the authors’ knowledge, alloy compositions of Fe-36Mn-7Al-9Ni (wt.%), Fe-17Mn-10Cr-5Si-4Ni (wt.%), and Fe-34Mn-8Al-7Ni (at.%) have been LPBF fabricated to date. In Fe-36Mn-7Al-9Ni alloy, a columnar and highly textured microstructure was noted in 0.5 mm sized parts built on a 200 °C preheated substrate[26], but the microstructure changed to equiaxed and columnar grains with a weak texture when the substrate was heated to 500 °C[21]. The conflicting trend in microstructural features was associated with the difference in substrate temperature that altered the temperature gradient and solidification rate[21]. Both Ferretto et al. and Kim et al. investigated the Fe-17Mn-10Cr-5Si-4Ni alloy and reported a change in microstructure as the laser power was varied[22,23,28]. A fully austenitic and equiaxed grain structure exhibiting a weak crystallographic texture was achieved at high laser power, but this changed to a highly elongated, weakly textured and δ-ferrite dominated structure at lower laser power. The authors suggested that the nucleation of the austenite grains from the δ-ferrite was possible at high laser power because of the low cooling rate in this setting. Lastly, Patriarca et al. fabricated a bulk and micro-lattice structured Fe-34Mn-8Al-7Ni alloys and heat treated the alloys to achieve a microstructure desirable for the pseudoelastic property[27].
The limited source of pre-alloyed powder may have restricted the research progress on the adaptability of the LPBF technique to Fe-based SMAs. Most of the studies on the additive manufacturing of Fe-based SMAs used pre-alloyed precursors. It is worth noting that Niendorf et al. and Wiesener et al. fabricated a Fe-based alloy with Ag for biomedical applications by mixing Ag powder with pre-alloyed high-manganese TWIP steel powder and Fe-Mn powder, respectively[29,30]. These studies achieved a microstructure with well-dispersed Ag particles that accelerated the corrosion rate of the Fe-Mn alloy. Mixing of metallic powder would therefore enhance the potential of the technique. The LPBF of homogenised powder is however challenging due to the difference in the thermal and optical properties between the powders and chemical inhomogeneity in the product[31], and this warrants the careful selection of processing parameters.
This study demonstrates that a Fe-Mn-Si SMA, a potentially biodegradable alloy, can be prepared from a blended metallic powder and processed using the LPBF technique. The influence of laser power, scan speed, and laser re-scanning on the solidified microstructure of the built product was examined. Then the solidification mechanisms were explained based on the knowledge gained from both the microstructure and the melt pool profile generated from a single laser scan track and the thermal profile of the melt pool region derived from a finite element analysis (FEA) method. The influence of grain size, composition of formed phases, and residual strain on the hardness of the as-built alloy were investigated according to the information gathered from XRD and EBSD analyses, and then compared with the reference as-cast alloy prepared using the arc-melting technique.
MATERIALS AND METHODS
Sample preparation
The Fe and Si powders used in the LPBF fabrication of Fe-Mn-Si alloy were gas atomised and provided by TLS Technik, Germany, while the Mn powder was from Merelex Corp, USA. Both the Fe and Si powders had a purity of > 99 wt.%, and the purity of Mn was > 98 wt.%, as estimated using the Malvern Panalytical Epsilon ED X-ray fluorescence spectroscopy (XRF), Supplementary Table 1. Figure 1A-C shows the scanning electron microscope (SEM) micrographs of the Fe, Mn, and Si powder. Their particle size and cumulative size distributions were measured using the Malvern Mastersizer 3000 and are shown in Figure 1D-F, respectively. A nominal powder composition of Fe-30Mn-6Si (wt.%) was homogenised for 4 h using the Turbula® T2F 3D mixer and then used as powder precursor. Meanwhile, the nominal concentration of Fe-30Mn-6Si reference as-cast alloy was prepared using the arc-melting technique from Fe, Mn, and Si high purity (> 99.9%) chips from Sigma-Aldrich. The arc-melted product was subsequently hot-rolled at ~800 °C and then homogenised at 1100 °C for 14 h in an argon-purged furnace. Homogenisation was performed by loading the sample at room temperature, heating it at 5 °C/min to 1100 °C, and followed by furnace cooling. The resulting sample is referred to hereafter as reference as-cast alloy and its properties were treated as a reference in the following investigations.
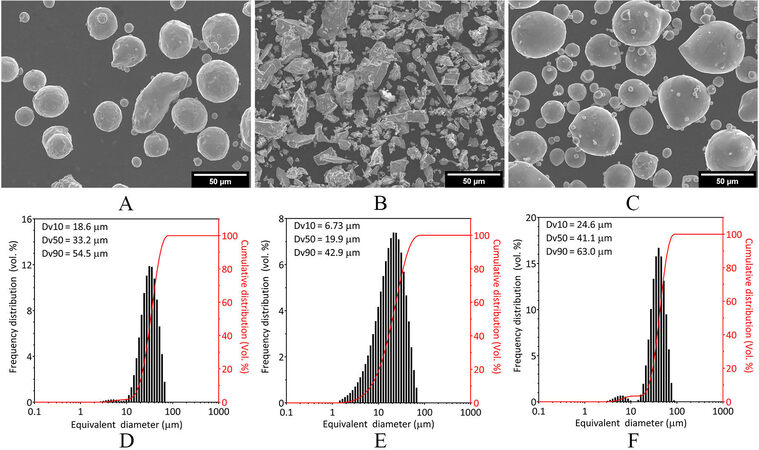
Figure 1. SEM micrographs of (A) Fe, (B) Mn, and (C) Si powders. Their corresponding particle size frequency and cumulative distributions are shown in (D-F), respectively.
The LPBF fabrication was carried out using the Mlab Cusing 200R from Concept Laser GmbH equipped with 200 W Yb:YAG fibre laser and the print chamber atmosphere was maintained up to 0.2 vol.% O2 using a high purity Ar gas. Only freshly homogenised powder was used, and all printed parts were built on a sandblasted stainless steel substrate. In identifying the optimum LBPF parameters, a 125 mm3 cube model was prepared using the Materialise Magics v24 software. The influence of both laser power and laser scan speed on the density of the built part was investigated by varying the laser power (P) from 100 W to 175 W and the laser scan speed (ν) from 400 mm/s to 600 mm/s while keeping a constant laser hatch spacing, layer thickness, and scan strategy at 45 μm, 50 μm, and island scan strategy, respectively. The scan strategy is unique to Concept Laser[32], where each island was maintained at 5 × 5 mm2 and was scanned by the laser in one direction. The laser scan direction was rotated by 90° between the neighbour islands, and finally, this whole pattern was rotated by 45° in the subsequent layer. A laser re-scan strategy was also included. This was done by scanning the solidified layer again at a varying percentage of laser power (0%, 50%, and 100%) that was applied in the first scan, laser scan speed from 400 mm/s to 600 mm/s, and a similar scan strategy to increase the laser linear energy density (LED). LED is a simplified energy parameter defined as the P/ν ratio and was considered when the layer thickness and laser space hatching were unchanged[33-35]. Table 1 summarises the parameters that were investigated.
LPBF processing parameters used for the fabrication of Fe-30Mn-6Si alloy
| Processing parameters | Values |
| Laser power (W) | 100, 125, 150, 175 |
| Scan speed (mm/s) | 400, 500, 600 |
| Re-scan (%) | 0, 50, 100 |
LPBF product quality assessment
The density of the LPBF built parts was measured by applying the Archimedes method and using the Mettler Toledo XS105 balance with a density kit. All surfaces of the samples were ground down to 1200 SiC paper and then dried. Measurements were done on three replicates. The measured density was then divided by the theoretical density (7.408 g/cm3) and reported as relative density. In addition, the surface of the LPBF-built parts along the build direction was viewed under the Hitachi TM4000Plus bench-top SEM coupled with a Bruker X-Flash 630Hc EDS detector to further evaluate the product quality.
Microstructure characterisation
The crystallography and the phase volume fraction of both the reference alloy and the LPBF fabricated alloy were evaluated using the PANalytical Empyrean with a Co target (λ = 1.79 Å) and a scan range from 40 to 130° 2θ at a step size of 0.02°. The volume fraction of the phases in the samples was computed by applying a Rietveld refinement[36,37] using the HighScore Plus v5.1 Suite[38,39]. Refinement parameters such as the expected profile R-value, profile R-value, weighted profile R-value, goodness of fit, Bragg R-value, and the difference plot between the experimental and calculated XRD pattern were closely monitored during the refinement process. Also, refinement was done at least three times to verify the results, and the γ-austenite and ε-martensite phase volume fractions were subsequently validated using the electron backscattered diffraction (EBSD) technique [Supplementary Figure 1].
The EBSD was carried out to characterise the microstructure, i.e., grain morphology, crystallographic texture, and grain characteristics, of the reference alloy and built products. The sample surfaces for EBSD analysis were final polished up to OPU finish and then ion milled using the Hitachi IM4000 at 30° and 6 kV for 1 h to remove any polishing artefacts. The Zeiss Auriga Crossbeam Field-emission SEM equipped with a NordlysF detector for EBSD and an Oxford Instruments X-Max 20 mm2 silicon drift detector for EDS was used for the simultaneous SEM-EDS/EBSD analysis. The EDS and EBSD data were gathered using the AZtec 3.3 and then analysed using the AZtecFlex software suite. For EBSD analysis, a 500 × 500 μm2 area was scanned at a step size of 1 μm and only the results with at least 90% hit rate were analysed. Data cleaning was done by removing the wild spikes, and then using the “zero solutions removal” tool from level 1 up to level 4 while preserving any defects, i.e., cracks and pores, on the cleaned dataset. The grain size and shape analysis were subsequently done on the computed prior austenite grains[40] using the Shoji-Nishiyama orientation relationship[41] to reveal the likely austenite grains.
Simulation of melt pool thermal properties
Simulation of the 3D thermal profile during LPBF was conducted using the COMSOL™ Multiphysics software suite, in which a simplified finite element analysis (FEA) thermal model was developed. A tetrahedral mesh was used for the model geometry with a minimum and maximum mesh size of 2 μm and 16 μm, respectively. A 1 × 6 × 1 mm3 smooth flat plate model with no powder was used to provide a heat sink effect sufficient for simulating the single line scan. Laser irradiation heat input is modelled as[42,43],

where Q is volumetric heat flux (W/m2), P is laser power, A is laser absorption coefficient, R is laser beam radius, δ is laser penetration depth[44,45], |z| is z-coordinate absolute value, and x and y are laser x- and y-coordinates, respectively. The theoretical density was used as the material density for the simulation. Specific heat capacity and thermal conductivity at room temperature were taken from literature for the similar material Fe-28Mn-6Si-5Cr and are 544.2 J/(Kg∙K) and 8.37 W/(mK), respectively[46,47]. A single-track scan was first performed on a polished material surface of similar composition. Then, in the numerical simulation, the coordination of x and y scan speeds, as well as P and R, were the same as those used for the single-track scan. Determination of penetration depth δ and absorption coefficient A was conducted via an iterative process by matching the simulated melt pool with the observed melt pool
Hardness test
The resistance to localised plastic deformation of the LPBF built and reference alloy was measured using the Struers DuraScan hardness machine following a standard procedure[48]. The samples were resin mounted and then the surface was OPU polished. At least 10 indentations were made on each sample.
RESULTS AND DISCUSSION
LPBF product quality
The interaction of the powder bed and the laser system in the LPBF fabrication of Fe-30Mn-6Si was assessed by looking into the influence of relative density as a function of LED, as shown in Figure 2A. The P/ν ratio is the LED of the laser system where a high P value and a low ν value translate to a large amount of LED, and this is similar to what is being used in conventional fusion welding techniques[49]. The lowest LED of
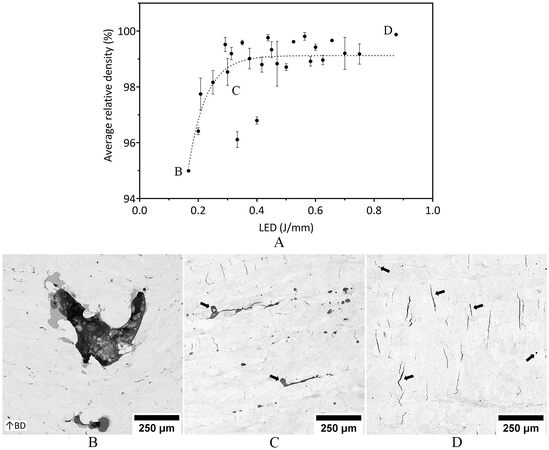
Figure 2. (A) The relationship between relative density and LED, and the representative SEM micrographs at (B) low (0.17 J/mm),
SEM micrographs of all samples built at different LBPF are analysed and their representative at low, mid, and high LEDs are shown in Figure 2B-D, respectively. These micrographs represent the LEDs labelled in Figure 2A. Pores of over 250 μm are seen at the low LED of 0.17 J/mm, and their morphologies are irregularly shaped, as seen in Figure 2B. At the mid LED of 0.25 J/mm, the large pores are not apparent, but chemical inhomogeneity is noted by the difference in contrast in the backscattered electron (BSE) micrograph and they are highlighted by the black arrows in Figure 2C. The high LED of 0.88 J/mm has no observed chemical segregation; defects like cracks and spherical pores are however noted, and they are marked by the black arrows in Figure 2D. Densification of LPBF fabricated parts is directly associated with the reduction of defects at high LED, and this is shown by the SEM micrographs in Figure 2B-D. Nevertheless, the high relative density and relatively few defects in the high LED above 0.44 J/mm, i.e., the lack of large irregularly shaped pores [Figure 2D and Supplementary Figure 3], make these parameters ideal for the LPBF fabrication of Fe-30Mn-6Si from homogeneously blended powder.
The recommended LED for Fe-30Mn-6Si alloy (≥ 0.44 J/mm) is higher than the suggested for pure Fe
Chemical composition
LPBF uses a high energy laser for melting and alloying of the metallic powders. Such energy may evaporate volatile components and alter the final composition of the alloy. An EDS analysis of the major elements Fe, Mn, and Si as a function of LED in Fe-30Mn-6Si LPBF alloy is shown in Figure 3A-C, respectively. As the LED is increased, the Fe content in the alloy is shown to increase, Mn is slightly decreased, and Si remains almost the same. The Mn element has the least melting point [Supplementary Table 2], high vapour pressure[57,58], and therefore more volatile than the other precursors[22,28]. Thus, its evaporation is expected during LPBF, resulting in a decrease in Mn concentration. Meanwhile, the slight increase in Fe likely influenced the relative density value. Fe had the highest density among the raw materials and the increase of its concentration likewise increased the alloy density. Therefore, careful selection of processing parameters and the adjustment of Mn concentration are necessary for the LPBF processing of homogenised powders.

Figure 3. Chemical composition of (A) Fe, (B) Mn, and (C) Si in LPBF alloy as a function of LED.
Microstructure
The influence of LPBF processing parameters on the microstructure was investigated using the EBSD micrographs of the LPBF-built alloy surface parallel to the building direction. The LEDs at 0.25 J/mm and 0.44 J/mm represent the low (100 W) and high (175 W) laser power, 0.29 J/mm and 0.44 J/mm for the low (400 mm/s) and high (600 mm/s) scan speed, and 0.44 J/mm and 0.88 J/mm for the 0% (175W, 400 mm/s) and 100% (175W, 400 mm/s and then 175 W, 400 mm/s) re-scan strategy, respectively.
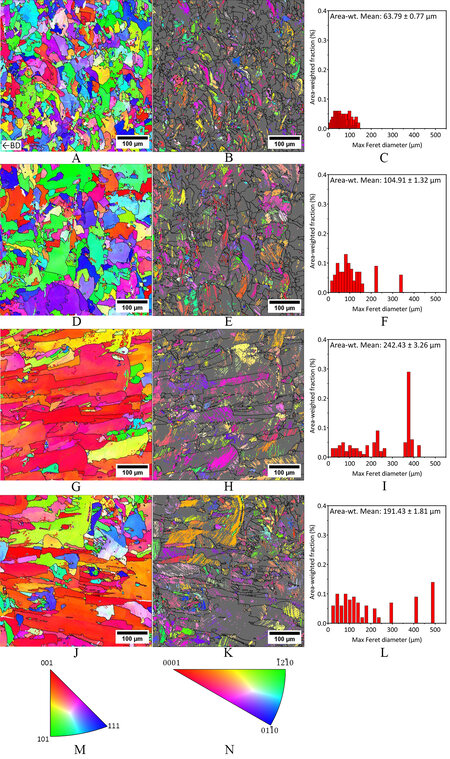
Figure 4. EBSD parent grain reconstructed IPF map, HCP ε-martensite IPF map, and the grain size distribution of Fe-30Mn-6Si LPBF-built alloy from LED of (A-C) 0.25 J/mm (100 W, 400 mm/s), (D-F) 0.29 J/mm (175 W, 600 mm/s), (G-I) 0.44 J/mm
The LPBF parameters also strongly influenced the crystallographic texture of the alloy. The predominance of a single colour in the EBSD IPF map indicated a substantially preferred orientation or strong texture. Figure 4G and J show that most of the cubic grains are aligned with their <001> direction parallel to the build direction in the 0.44 J/mm and 0.88 J/mm, whereas the texture was weak (broad range of colours) in 0.25 J/mm and 0.29 J/mm, Figure 4A and D, respectively. Therefore, the high LED and laser re-scan strategy generated prior austenite columnar grains that grow in their <001> direction parallel to the building direction. Meanwhile, Figure 4B, E, H, and K display the randomly orientated HCP martensite phase within the austenite grains.
The X-ray spectra of the Fe-30Mn-6Si reference alloy and the LPBF alloy made from different processing parameters were gathered and quantified using the Rietveld refinement method. The results are then shown in Figure 5 and Table 2. The major phases identified in the LPBF alloy are γ-austenite and ε-martensite because of their intense XRD peaks and composition that is ≥ 19 wt.%, as seen in Table 2. A dual-phased microstructure is expected in the Fe-30Mn-6Si alloy that underwent post-process treatment[59], while the homogenised alloy may be single-phase austenite[60], and such is observed in Figure 5. The existence of the γ and ε phases in the LPBF alloy is due to the far-from-equilibrium process conditions of the technique. Table 2 also reveals three other phases in the LPBF alloy; α-FeMn, α-FeSi, and FeO. The presence and composition of these phases are observed to vary in the LPBF alloy prepared for different parameters. For example, FeO was identified at 0.25 J/mm and 0.44 J/mm but not at 0.29 J/mm and 0.88 J/mm. Upon close inspection at 54.3° 2θ in the 0.29 J/mm, its 10
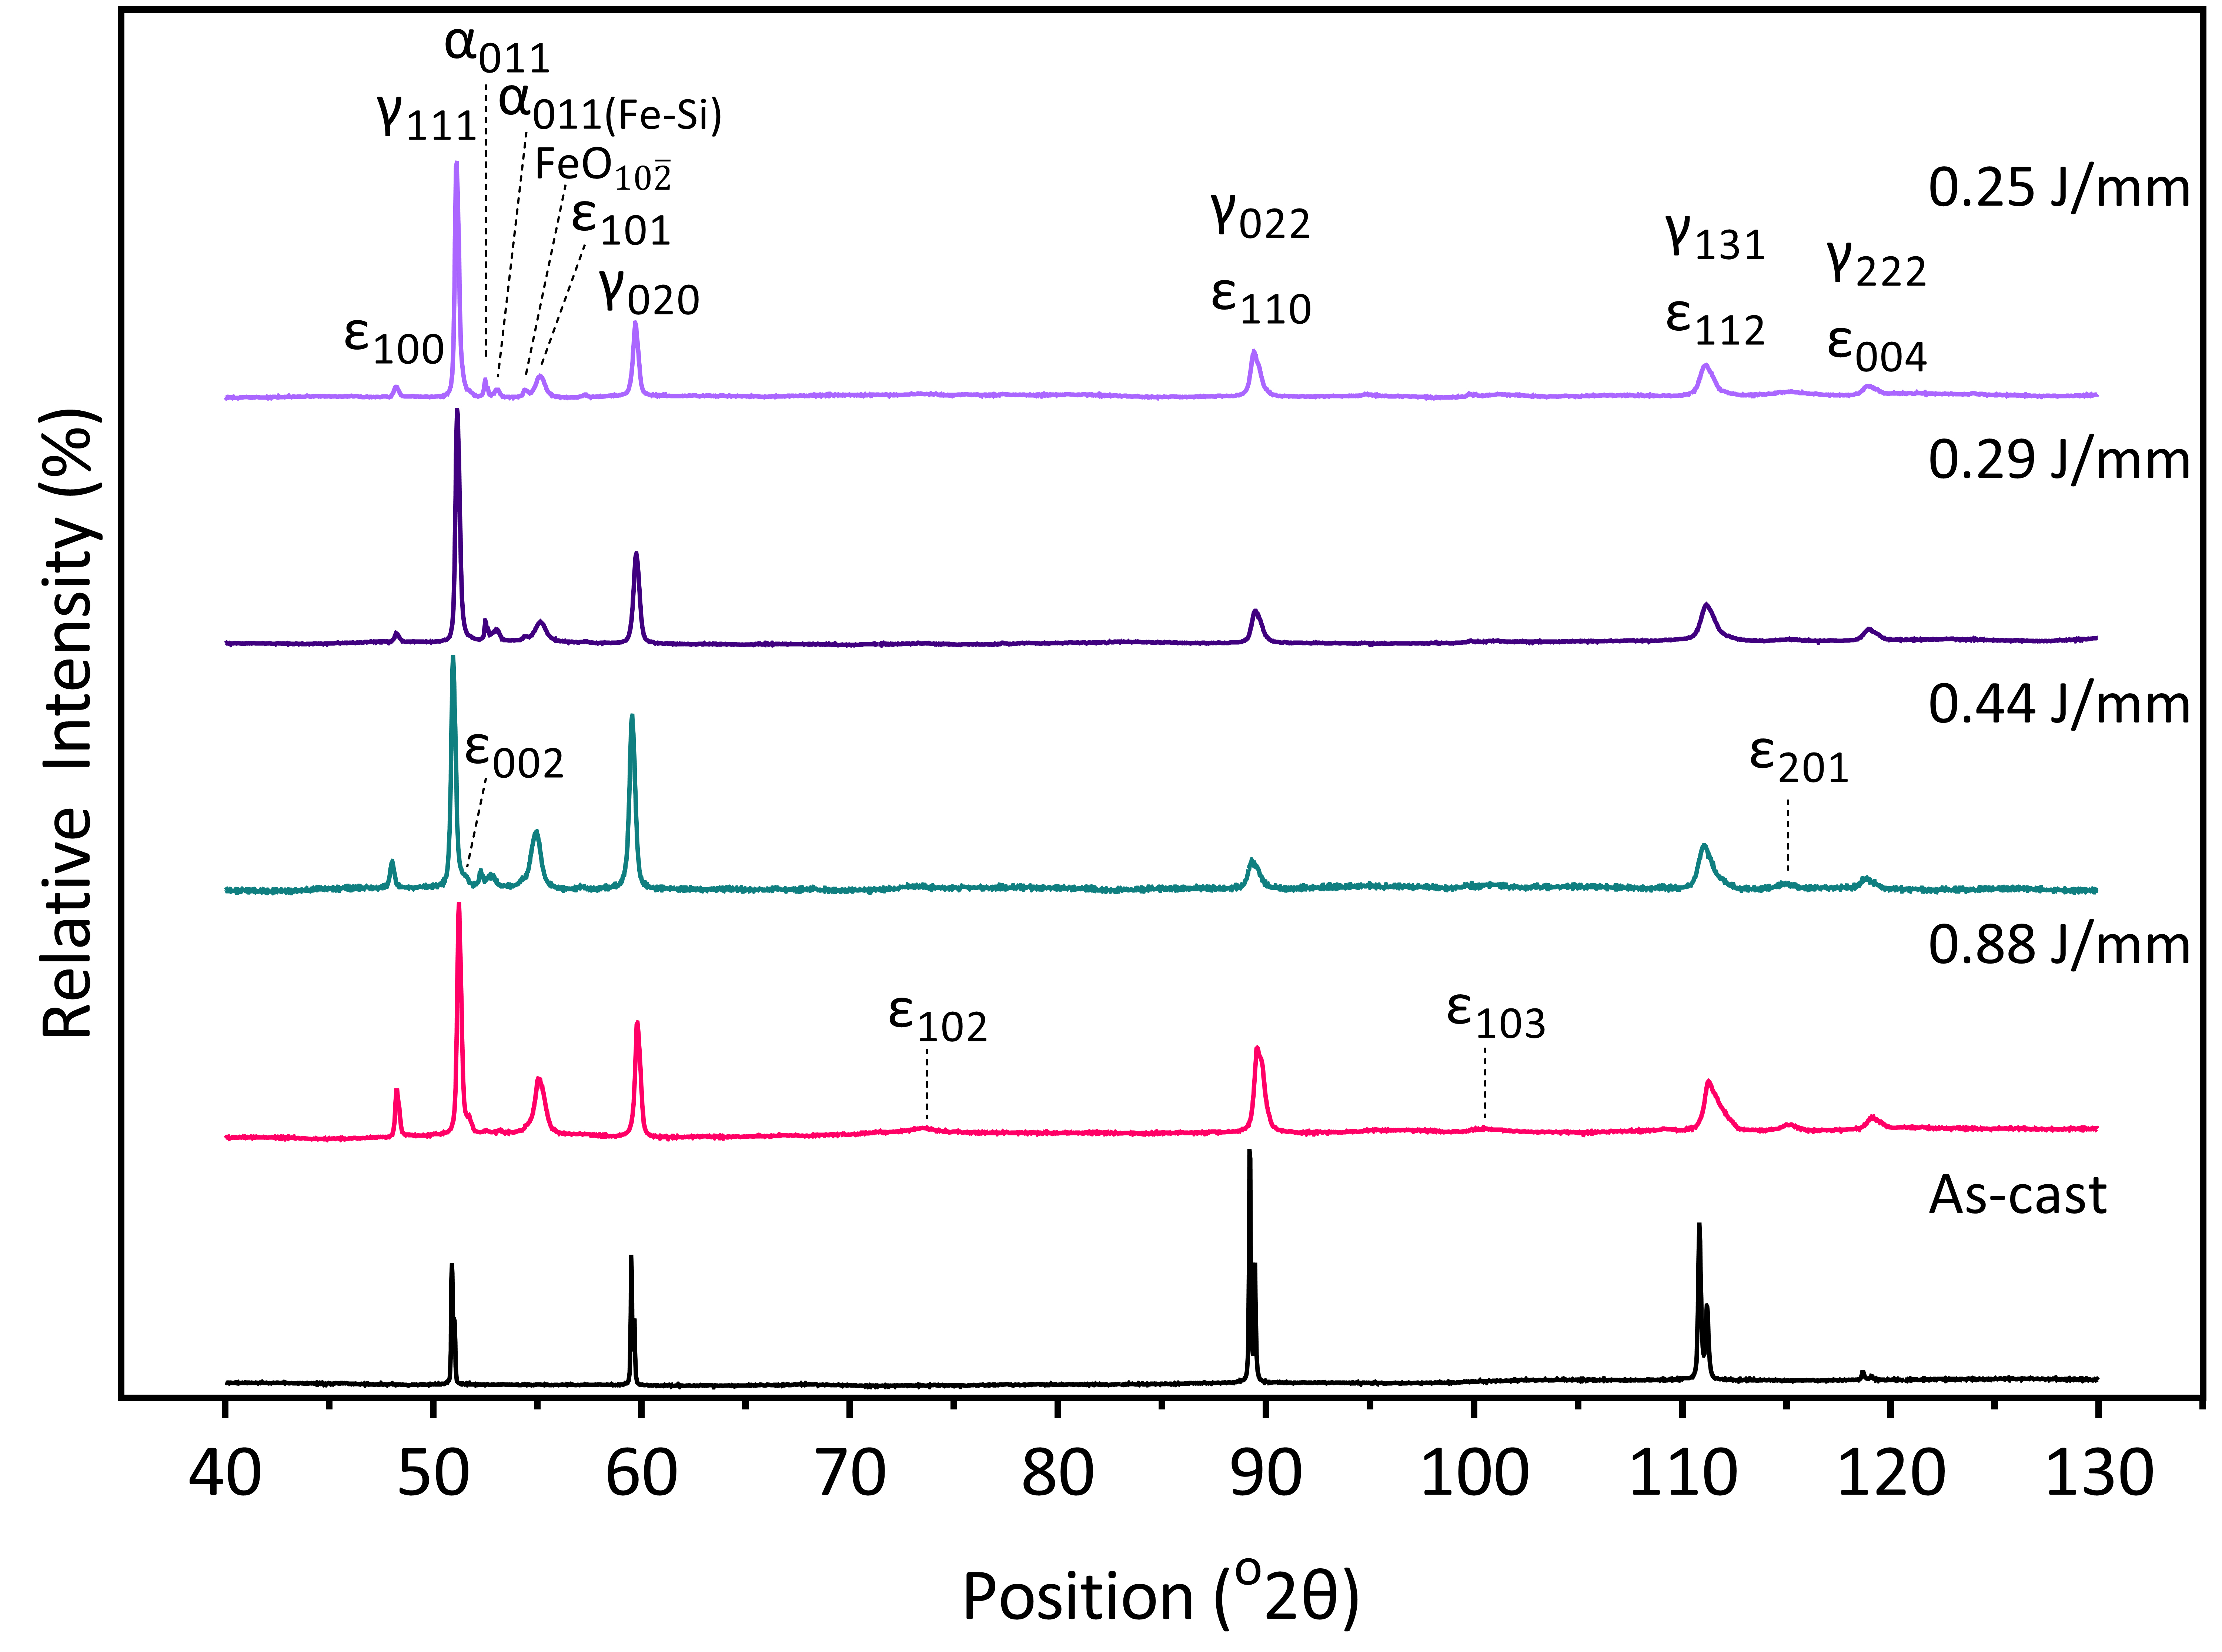
Figure 5. The XRD patterns of the Fe-30Mn-6Si reference alloy and the LPBF alloy prepared at different process settings.
Derived crystal structure, lattice parameters, phase compositions, Bragg R-value (RBragg), and goodness of fit (GOF) of the LPBF parts built at 0.44 J/mm and 0.88 J/mm energy parameter and then homogenised and HIP treated and reference as-cast alloy using the Rietveld refinement of the XRD patterns.
| LED (J/mm) | Phase | Space group | Lattice parameter | Content (vol.%) | RBragg | GOF | |
| a (Å) | c (Å) | ||||||
| 0.25 | γ-austenite | Fm | 3.600 | - | 74.6 | 1.72 | 4 |
| ε-martensite | P63/mmc | 2.535 | 4.133 | 19 | 1.99 | ||
| α-FeMn | Im | 2.867 | - | 2.3 | 1.39 | ||
| α-FeSi | Im | 2.840 | - | 2.2 | 2.19 | ||
| FeO | R | 2.648 | 7.585 | 1.9 | 1.76 | ||
| 0.29 | γ-austenite | Fm | 3.600 | - | 68.5 | 2.76 | 3.518 |
| ε-martensite | P63/mmc | 2.537 | 4.125 | 23.9 | 1.37 | ||
| α-FeMn | Im | 2.868 | 2.8 | 1.33 | |||
| α-FeSi | Im | 2.843 | 4.9 | 0.39 | |||
| 0.44 | γ-austenite | Fm | 3.600 | 62.1 | 1.07 | 2.196 | |
| ε-martensite | P63/mmc | 2.535 | 4.141 | 31.2 | 0.79 | ||
| α-FeSi | Im | 2.847 | 6.3 | 0.44 | |||
| FeO | R | 2.535 | 0.4 | 1.71 | |||
| 0.88 | γ-austenite | Fm | 3.598 | 52.5 | 2.31 | 3.928 | |
| ε-martensite | P63/mmc | 2.540 | 4.123 | 45.8 | 1.72 | ||
| α-FeMn | Im | 2.868 | 1.4 | 0.84 | |||
| α-FeSi | Im | 2.837 | 0.2 | 1.01 | |||
| As-cast | γ-austenite | Fm | 3.602 | 100 | - | - | |
Key microstructural features associated with LPBF processing, such as the types and volume fraction of phases present, solidified grain size, morphology, and texture of the processed samples, were strongly influenced by the laser power, scan speed, and re-scan strategy. This shows that the desired microstructure is tailored by controlling laser power and scan speed to change the LED. The information on the thermal history of the resultant product is, however, necessary to completely understand the development of the microstructure.
Melt pool of single laser track scan
A polished surface of the reference alloy was subjected to single track laser scans at various LEDs. This resulted in the melting and subsequent solidification along the laser tracks, which generated a certain melt pool morphology for a given LED, when viewing a cross section perpendicular to the laser track. The effect of LED on the cross section of melt pool morphology is shown in Figure 6. Figure 6C and D show that a high LED creates both a deep and wide melt pool that penetrates at least 120 μm below the polished surface. In contrast, a low LED generates a relatively shallow melt pool of 50 μm deep [Figure 6A]. In Figure 6B, the melt pool became wide and deep when the LED was slightly increased from 0.25 J/mm to 0.29 J/mm by increasing the laser power from 100 W to 175 W and scan speed from 400 mm/s to 600 mm/s. Overall, there is sufficient lateral overlap of the melt pool tracks because the width of the melt pool is wider than the
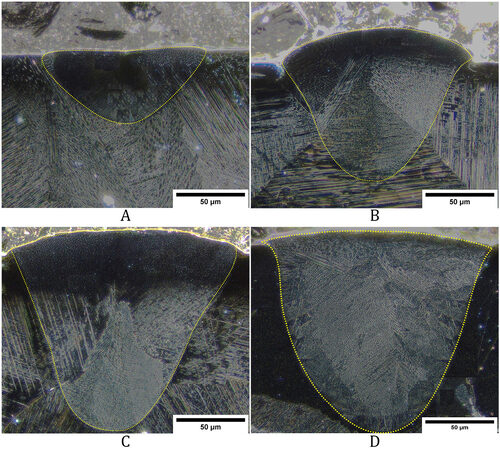
Figure 6. The single laser scan melt pool profile on the polished Fe-30Mn-6Si reference alloy at varying LEDs of (A) 0.25 J/mm, (B) 0.29 J/mm, (C) 0.44 J/mm, and (D) 0.88 J/mm.
The melting mode at low LED (0.25 J/mm), as defined by Tenbrock et al., is conduction mode, and the rest, 0.29 J/mm to 0.88 J/mm, are in keyhole mode[61]. In the authors’ single laser track investigation on 316 L stainless steel, the group used the melt pool depth-to-width ratio threshold of less than 0.8 as the conduction mode; above 0.8, the keyhole mode of melting transpired. Conduction mode of melting was observed at low LED, where the underlying regions are heated through the energy conducted from the surface[62]. In the keyhole mode of melting, the high LED evaporated the metal and left a vapor cavity in the melt pool that enhanced laser absorption and enabled a deeper melt pool than in conduction mode[63].
Simulated melt pool thermal profile
Using the melt pool profiles and a finite element analysis technique[64] on the LPBF of Fe-30Mn-6Si alloy, the thermal profiles through the penetration distance of the melt pools were calculated as a function of laser scan strategy. The derived thermal conditions at different LPBF process settings as a function of melt pool depth are presented in Figure 7. It is known that the solidified microstructure prepared using the LPBF technique follows the solidification theory[65-67], where the morphology is affected by the extent and direction of the temperature gradient and the solidification rate of the melt pool[68]. Likewise, the cooling rate, a product of temperature gradient and the solidification rate[69], dictates the size of the solidified structure[70]. Therefore, the temperature gradient and the solidification and cooling rates are computed, and the temperature profiles are also derived.
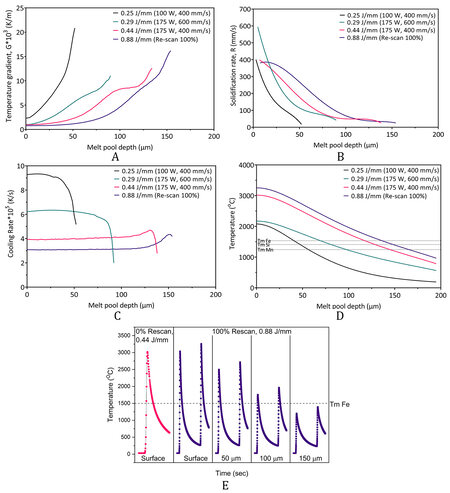
Figure 7. Computed thermal profile of the LPBF fabricated Fe-30Mn-6Si alloy. (A) temperature gradient, (B) solidification rate,
Figure 7A shows the variation in the temperature gradient within the melt pool for different LEDs. A low temperature gradient is initially observed from the surface of the melt pool, and it increases as solidification proceeds, leaving the bottom layer with the highest temperature gradient values of over 104 K/m. The LPBF process has a typical temperature gradient range of 104 to 107 K/m[71]. Temperature gradients between 104 to 105 K/m were associated with large melt pools[72], and such were observed in the melt pool profile
The solidification and cooling rates were numerically evaluated and remarked to be significantly influenced by scan speed than by laser power[73,74]; hence, their influence at varying LED was evaluated. In the LPBF process, the solidification of the molten melt pool proceeds as the laser track leaves the melt pool. The rate of solidification at varying LED was presented in Figure 7B, where the rate at the surface of the melt pool was similar to the applied scan speed. The 0.29 J/mm LED had a faster solidification rate at the surface compared to the rest of the LEDs because a scan speed of 600 mm/s was applied. All the solidification rates decreased sharply from the surface of the melt pool until the 50 μm depth, but the slope was noticeably steeper at 0.25 J/mm and 0.29 J/mm LEDs than at 0.44 J/mm and 0.88 J/mm LEDs. After the 50 μm depth, the solidification rate for 0.29 J/mm LED decreased slowly. For 0.44 J/mm and 0.88 J/mm LEDs, the slope of the solidification rate only changed after ~90 μm and then became stable at 50 mm/s.
The fast-moving laser in LPBF imparts a high cooling rate of 104 to 106 K/s[75-77]. Presently, a cooling rate of 105 K/s was noted in the Fe-30Mn-6Si LPBF-built alloy. The relationship between LED and the cooling rate was observed in Figure 7C. From the surface of the melt pool, at 0 μm melt pool depth, the cooling rate was constant and then dropped at a particular depth depending on the LED. Its magnitude was also dependent on LED. The low LED (0.25 J/mm) had a stable cooling rate of 9.28 × 10⁵ K/s up to ~30 μm melt pool depth, and for 0.29 J/mm LED, it was stable at 6.21 × 10⁵ K/s until ~60 μm deep. For the LEDs of 0.44 J/mm and 0.88 J/mm, the cooling rates were rather stable until ~120 μm deep at 3.93 × 10⁵ K/s and 3.09 × 10⁵ K/s, respectively. Moreover, the percentage change in the cooling rates after varying the laser power and scan speed was the same at ~58%. When the laser power was raised from 100 W to 175 W, the cooling rate dropped from 9.28 × 10⁵ K/s to 3.93 × 10⁵ K/s, while the increase in scan speed from 400 mm/s to 600 mm/s increased the cooling rate from 3.93 × 10⁵ K/s to 6.21 × 10⁵ K/s.
The maximum calculated temperature in the melt pool as a function of melt pool depth for different LEDs derived from the FEA analysis is shown in Figure 7D. The melt pool temperature responds positively to the increase in LED, and it is observed to decrease within the melt pool. For example, at the melt pool surface, a temperature of roughly 2081 °C, 2173 °C, 3019 °C, and 3256 °C was computed for 0.25 J/mm, 0.29 J/mm, 0.44 J/mm, and 0.88 J/mm LEDs, and it decreased to 1360 °C, 1755 °C, 2484 °C, and 2716 °C at 50 μm melt pool depth, respectively. As a guide for the melting of the powder, the melting points of the constituent elements (Fe = 1535 °C, Si = 1410 °C, and Mn = 1245 °C) in the blended powder are likewise inscribed in Figure 7D. The observed temperatures at the melt pool surface are beyond the melting temperature of the powder, which may have likely evaporated some elements. In particular, the loss of manganese is expected when an LED over 0.25 J/mm is applied because of its relatively low boiling temperature (Fe = 2750 °C,
The solidified surface of the LPBF-built alloy fabricated at 0.44 J/mm LED was re-scanned at 175 W and
Microstructure evolution
Both the highly directional heat flow conditions and large temperature gradients generated during laser melting of an outermost layer of metal powder, which usually also resulted in the partial remelting of the already solidified grains of the underlying built substrate, favour epitaxial growth of these existing grains in certain crystallographic directions towards the heat source (i.e., they grow antiparallel to the direction of heat flow into the underlying substrate). For certain laser input conditions, a highly directional columnar morphology and strong texture were frequently observed in LPBF-built alloys[80,81]. However, the EBSD maps shown in Figure 4 revealed a gradual change in the microstructure from a nearly equiaxed to columnar grain structure as the LED was increased.
The equiaxed-to-columnar transition in the grain structure was commonly observed within the melt pool, and this transition depends on the alloy chemistry and the heat transfer conditions according to the LPBF processing conditions[64,82-86]. A near-homogeneous grain structure with weak texture was achieved when Attard et al. applied the island scan strategy or checkerboard style[87], a standard parameter unique to the setup[32], and when Ewald et al. heated the build platform to 500 °C[21]. Attard’s group associated this with the even distribution of heat in the island scan strategy. Meanwhile, the heated build platform in the 0.5 mm sized product reduced the temperature gradient in Ewald et al.’s LPBF product, which also reduced the temperature gradient and promoted a nearly homogeneous and equiaxed microstructure[21]. The lack of grain morphology transition in the melt pool in the present Fe-30Mn-6Si LPBF alloy may have been caused by the island scan strategy with 45° scan rotation in the subsequent layers, leading to a homogeneous grain morphology in each parameter setting.
The similar microstructures of LPBF processed parts and conventionally welded components make it convenient to describe the solidified LPBF microstructure in terms of the well-established physical metallurgy principles associated with fusion welding[69]. Grain shape and scale were defined by the solidification theory, and may be controlled by the temperature gradient G, solidification velocity R, the temperature solidification range of an alloy ∆T, and the liquid diffusion coefficient DL[65,67]. The relationships between these key solidification parameters are given below[66]:
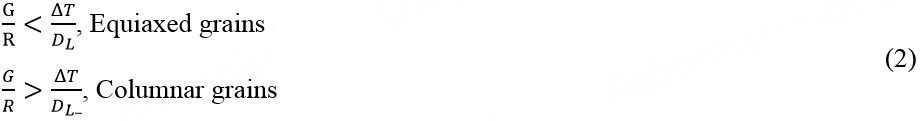
where the G/R ratio and the G·R product, which is the cooling rate, can predict the morphology and dimensions of the solidified microstructure, respectively. For example, a low G/R value correlates to equiaxed grains, with the morphology transitioning to columnar dendritic, cellular, and then to planar for increasing values of G/R, and the high cooling rate resulted in a fine solidified grain structure[70]. Investigation of the thermal history of LPBF-processed alloy was necessary for understanding its expected final microstructure, and in Figures 4 and 7, the select parameters showed that the different thermal profiles affected both the morphology and dimensions of the solidified grains.
The solidification of grains in LPBF-processed alloys follows the well-established nucleation and growth processes in solidified metals and alloys. Li and Tan[88] provided the general grain characteristics of LPBF alloys and summarised two possible nucleation mechanisms: (i) bulk nucleation; and (ii) epitaxial or surface nucleation. Bulk nucleation occurs on the top side of the melt pool and at the head of a solidification front[88]. Nuclei also form from the partially melted powder in the melt pool[89], and they can survive given a sufficient volume of surrounding undercooled liquid metal[90]. These formed grains then assume an equiaxed morphology due to the low G/R ratio on the top side of the melt pool[91]. Epitaxial nucleation occurs at the interface of the melt pool and the substrate, or at the previously solidified layer[92]. A high LED and a low solidification rate in the melt pool encouraged grains to grow in a preferred crystallographic orientation[93], which was <100> for cubic and <1010> for hexagonal metals, respectively[69]. Grains possessing these favoured orientations outgrew grains with less favourable orientations[65], eventually generating a highly textured, columnar microstructure[94].
The prevalence of a highly textured and columnar grain morphology at the high LED settings [Figure 4G] suggested an epitaxial mechanism. Without an added and known potent nucleating particle in the elemental mixture and because of the steep temperature gradient on melting and solidification, the previously solidified layer would act as a suitable substrate for continued growth into the melt pool, whereby the partly melted grains propagate by epitaxial “nucleation” towards the heat source. Equiaxed grains may form on the top surface of the melt pool when the melt pool trail ended because of the low G/R ratio in this region, and such was seen on the last fabricated layer in NiTi[86]. In the Fe-30Mn-6Si, at 0.44 J/mm LED, a temperature gradient = 9.83 × 10² K/m, cooling rate = 4 × 10⁵ K/s, the slow solidification rate of R = 3.98 × 102 mm/s, and the melt pool temperature of ~1300 °C at 140 μm melt pool depth were sufficient to melt the solidified equiaxed grains in the previous laser scan and then subsequently re-solidify into columnar grains. A similar grain morphology holds for the laser re-scanned LPBF alloy, albeit grains were relatively fine and less columnar when laser re-scanning was applied.
The re-scan strategy had been reported to improve surface quality[66], increase density[95], and reduce residual stress[96] in AM components. This additional step was included in this study to enhance the alloying of the blended powders, and this resulted in a notably different microstructure from that of a non-re-scanned alloy. The melt pool width, depth and overall area associated with the re-scan strategy [Figure 6D] were considerably larger than after single scanning [Figure 6C], and this is caused by the higher thermal conductivity of the solidified layer than the powder material[97]. Hence, the enhanced heat transfer in the solidified layer resulted in a more pronounced melt pool, which was reflected in the calculated thermal profile. A coarse and columnar grain structure was still expected in the laser re-scanned LPBF alloy because the parent grains in the non-re-scanned alloy have solidified into columnar grains. The relatively gentle slope of solidification for 0.88 J/mm LED [Figure 7B] and its low cooling rate (3 × 10⁵ K/s) promoted the epitaxial growth of columnar grains, but its temperature profile shown in Figure 7D suggested that remelting of the previously solidified layer had occurred.
Completely remelting an alloy reshapes its microstructure, and such was evident in this work by the decrease in the average grain size and aspect ratio in the remelted LPBF alloy. A region of coarse and refined grains was apparent on close inspection in the re-solidified structure (marked areas in Figure 4J).
For the low LED (0.25 J/mm), the melt pool temperature at 50 μm pool depth was 1360 °C which was enough to melt the blended powders and potentially melt the surface of the previously solidified layer. However, the high cooling rate of 9 × 10⁵ K/s and the high solidification rate at this setting resulted in the retention of the equiaxed grain morphology. Moreover, the chemical segregation [Figure 2C] preserved in this LED suggests the presence of partially alloyed powder both in the melt pool and the solidified layer when the next layer was melted. The bulk nucleation mechanism was favoured in the presence of partially alloyed powder since they can act as heterogeneous nucleation sites and impede the epitaxial growth of the previously solidified equiaxed grains at the bottom of the melt pool[100].
For the high laser power and fast scan speed (175 W, 600 mm/s, 0.29 J/mm), the melt pool depth of 110 μm could get through an equivalent of two powder layers and had enough heat to sufficiently remelt the previously solidified layer and re-solidify them into a full-columnar structure. However, the solidified grains shown in Figure 4D were equiaxed and rather coarse (105 μm) compared to the finer grains (64 μm) associated with the low LED (0.25 J/mm) in Figure 4A. The partially melted powder observed at this setting could have induced the bulk nucleation of the grains and interrupted the epitaxial growth of grains.
The significant influence of the studied processing parameters on the resultant LPBF microstructure presents an opportunity to control the microstructure and texture, and therefore the properties of any given component. For instance, a columnar and textured grain structure is ideal for the pseudoelastic behaviour seen in Fe-Mn-Al SMAs[101,102] and the unrestricted martensitic phase transformation for shape memory in Cu-based SMAs[103].
Possible factors influencing hardness
Effect of grain size
Figure 8 shows the hardness of the LPBF-built alloy prepared as a function of LED. The two low LEDs (0.25 and 0.29 J/mm) have a close hardness value (278 ± 7.6 and 273 ± 3.9 HV2, respectively). The hardness in the two high LEDs (0.44 and 0.88 J/mm) is also close (287 ± 5.5 and 292 ± 3.6 HV2, respectively.) Meanwhile, the reference as-cast alloy had the lowest hardness (226 ± 6.7 HV2). The hardness of the material varies with grain size according to the classic Hall-Petch relation[104,105]. Also, in Figure 8, the grain size increases with an increase in LED up to 0.44 J/mm, and then drops when the laser re-scanning step was added to achieve
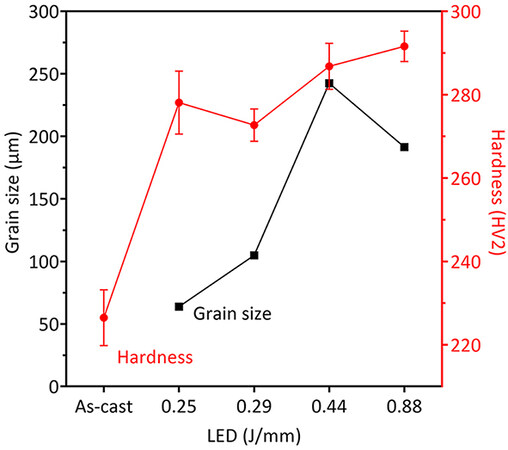
Figure 8. Relationship between grain size and hardness for both the reference alloy and the LPBF alloy fabricated at different LEDs.
Effect of phase types
Figure 9 shows the relationship between the volume fraction of phases and hardness as the LED is increased. This parameter was also found to influence the relative volume fractions of austenite and
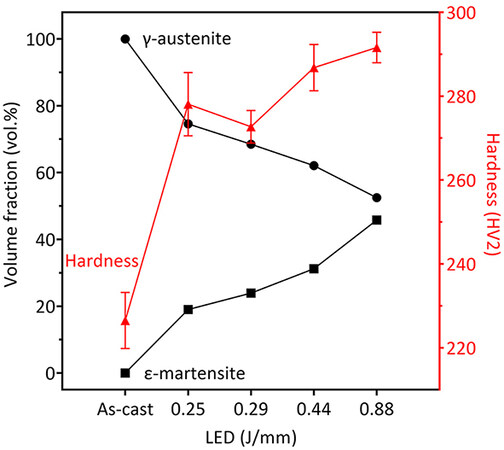
Figure 9. The relationship between γ-austenite and ε-martensite phase fractions and hardness for both the reference alloy and the LPBF alloy fabricated at different LEDs.
Boundaries exist between the phases in a multi-phased material, and each phase has a distinct characteristic[114]. The reference alloy was fully austenitic, whereas the LPBF alloy contains both austenite and ε-martensite, and other minor phases [Figure 5 and Table 2]. Since austenite is much softer than ε-martensite[115], this resulted in the low hardness of the reference alloy. In comparison, the amount of austenite and the pre-existing ε-martensite in the LPBF alloy, for example, in 0.44 J/mm LED, were 62% and 31%, respectively. The relationship between hardness and the volume fraction of ε-martensite has also been reported in a powder metallurgy fabricated Fe-30Mn-6Si alloy[116]. A high hardness was found in the as-sintered condition, but it decreased after heat treatment because of the corresponding decrease in ε-martensite. The addition of 5 wt.% Cr, an austenite stabiliser[117,118], in an as-cast Fe-30Mn-6Si alloy also resulted in a soft alloy due to the absence of ε-martensite[119].
Pre-existing ε-martensite has been reported to block plastic flow, which leads to high work hardening[120]. The impeding action of pre-existing ε plates was observed by Sato et al. using TEM, and they also reported a hardened Fe-30Mn-1Si alloy[1]. The group likened the ε plate phase boundary to a grain boundary. In the
Effect of residual strain
The far-from-equilibrium processing conditions in LPBF introduce residual strains that may also influence hardness. Since residual strain is associated with crystal misorientation[121-124], the relationship between crystal misorientation and hardness is presented in Figure 10. Comparing the reference alloy and the LPBF alloy prepared at 0.44 J/mm LED, the hardness of the former was significantly lower (227 HV2) than the latter (287 HV2). The corresponding average Kernel average misorientation (KAM) in the reference alloy is also lower (0.44°) than in the LPBF alloy (0.64°). A high residual strain has been associated with a high density of low-angle grain boundaries[125] and, as such, the density of these boundaries (2° to 10° misorientation) in both the reference and LPBF alloys were measured by EBSD to be 3% and 7%, respectively. Hu et al. reported that in pure Ti sheet, the hardening effect due to low-angle boundaries was dependent on the level of strain[126]. At strains up to 30%, the high-angle boundaries (HAGB) contributed to the hardness, but for strains above 30%, the density of the low-angle boundaries (LAGB) increased. The latter was suggested to be the biggest contributor to hardness. This was also noted in both 304 L stainless steel and Ni-Co alloys, whereby the hardness increased with increasing residual strain[127], and in a Fe-Ni alloy, the hardness decreased when the residual strain was relieved[128]. A dislocation has to overcome the grain boundary energy, both high- and low-angle, for it to move through the boundary, and the magnitude of the LAGB interfacial energy is a function of the degree of crystallographic misalignment[114]. Thus, the high hardness in the LPBF alloys as compared to the reference alloy was also caused by the inherent residual strain that resisted the localised deformation.
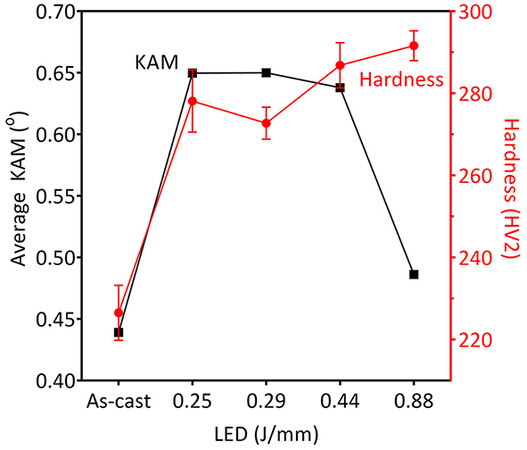
Figure 10. The relationship between residual strain (average KAM value) and hardness for both the reference alloy and the LPBF alloy fabricated at different LEDs.
Figure 10 shows a positive correlation between the average crystal misorientation from EBSD analysis and the computed temperature gradient using the FEA of the melt pool as a function of LED at differing depths from the melt pool surface. On the top surface of the melt pool, the highest temperature gradient
The residual strain in the LPBF alloy is caused by the local heat application of the laser, which introduces tensile stress in the molten layer and compressive stress in the solidified lateral and underlying layers[129]. These stresses, if not released, result in residual plastic strains. Several authors looked into minimising thermal stress in the LPBF-fabricated alloy. Vrancken et al., Lu et al., and Liu et al. agreed that a short laser scan length introduced less thermal stress, while Mishurova et al. emphasised the importance of large melt pool volume to lessen thermal stress[130-133]. The scan strategy was maintained during the LPBF of
The residual strain in the LPBF alloy, according to the average crystal misorientation data, was also shown in Figure 10 to decrease with increasing LED. This was reported to increase the hardness[127], and when the residual strain was relieved, the hardness decreased[128]. For this reason, the relationship between the average KAM value and hardness in both the reference alloy and LPBF alloy at different processing conditions was investigated. However, the decrease in residual strain corresponded to an increase in hardness, as seen in Figure 10, which differed from the previous reports[126-128]. Therefore, the residual strain may have indeed been relieved from the LPBF alloy through the formation of cracks, particularly in 0.88 J/mm LED.
The influence of grain size, presence and volume of phases, and residual strain was analysed to identify the possible factor affecting the hardness of the LPBF-fabricated Fe-30Mn-6Si alloy. Hardness is known to increase as the grain size decreases, ε-martensite volume fraction increases, and residual strain increases. It was observed that the increase in hardness was mainly influenced by ε-martensite at high LEDs of
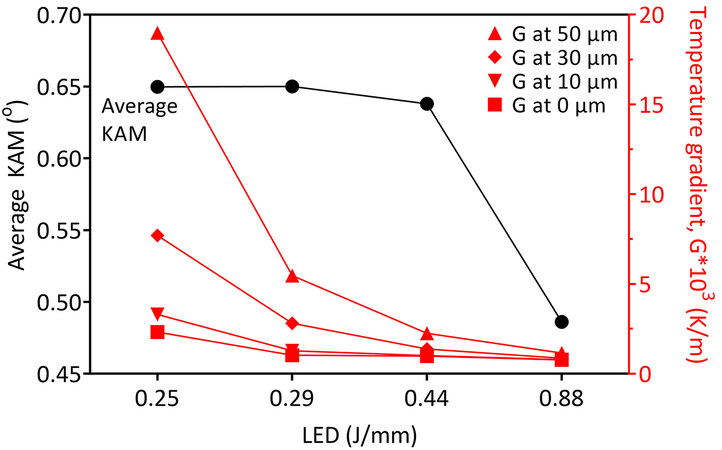
Figure 11. The relationship between crystal misorientation (average KAM) and temperature gradient derived from the simulated thermal profile of the melt pool as a function of LED at differing depths from the melt pool.
CONCLUSIONS
A LPBF technique is normally carried out using pre-alloyed powder, but the supply of pre-alloyed powder is limited, thereby confining this technique’s adaptability to readily available raw materials. It was demonstrated for the first time that a Fe-30Mn-6Si alloy with a known combination of biodegradable and SMA properties can be built using the LPBF technique from a homogenised metal powder. The LPBF parameters were investigated by varying the laser power, scan speed, and re-scan strategy. A density of over 99% was achieved at a range of LED from 0.30 J/mm to 0.88 J/mm, with 0.44 J/mm as the recommended LED for a high-density product. The resultant microstructure was shown to respond with the laser power and scan speed settings, and the changes in microstructure were explained using the FEA analysis of the melt pool profile derived from the single laser track scan. For example, the microstructure transitioned from one that was highly columnar and textured at high laser power to one that was fine and nearly equiaxed with weak texture at low laser power. Increasing the scan speed at high laser power setting eliminated the strong texture and increased the grain size. However, laser re-scanning of the solidified layer remelted the columnar grains and re-solidified them into non-uniform microstructure.
The hardness of the as-built LPBF alloys was also systematically assessed. The relationships between grain size, types and amounts of phases, and crystal misorientation on the hardness of both the reference and the LPBF alloys at different process settings were investigated. The hardness of the single-phase austenitic reference alloy was found to be affected by the grain size and residual strain. In the LPBF alloy, the fraction of ε phase strongly influenced the hardness. The pre-existing, thick ε plates may have blocked the nucleation and growth of the stress-induced ε plates in the LPBF alloy, which effectively hardened the LPBF alloy. Overall, this study expanded the processing capability of the LPBF technique by fabricating a Fe-Mn-Si alloy from a homogenised powder and elucidated the influence of processing parameters on the microstructure and the hardness of the product.
DECLARATIONS
Authors’ contributionsConception, design, writing, and editing: Dela Cruz ML, Yakubov V, Li X, Ferry M
Data collection and analysis: Dela Cruz ML, Li X, Ferry M
FEA simulation methodology and analysis: Yakubov V, Dela Cruz ML
All authors contributed to the manuscript and were involved in discussion.
Availability of data and materialsNot applicable.
Financial support and sponsorshipThe authors acknowledge the support of Australian Research Council (ARC) Discovery Early Career Researcher Award (DECRA) DE190101495, the Philippine Department of Science and Technology through the Engineering Research for Development and Technology Program (ERDT-DOST), UNSW Tuition Fee Scholarship, the Australian Government Research Training Program Scholarship for funding Michael Leo Dela Cruz’s PhD fellowship, and the technical support from the Mark Wainwright Analytical Centre at UNSW including the facilities and staff of Microscopy Australia at the Electron Microscope Unit (EMU) and the Solid State & Elemental Analysis Unit (SSEAU).
Conflicts of interestAll authors declared that there are no conflicts of interest.
Ethical approval and consent to participateNot applicable.
Consent for publicationNot applicable.
Copyright© The Author(s) 2023.
Supplementary MaterialsREFERENCES
1. Sato A, Chishima E, Soma K, Mori T. Shape memory effect in γ⇌ϵ transformation in Fe-30Mn-1Si alloy single crystals. Acta Metall 1982;30:1177-83.
2. Dunne D. Shape memory in ferrous alloys. In phase transformations in steels, Pereloma E, Edmonds DV, editors. Soston, UK: Woodhead Publishing; 2012, pp. 83-125.
3. Alaneme KK, Okotete EA. Reconciling viability and cost-effective shape memory alloy options - a review of copper and iron based shape memory metallic systems. Eng Sci Technol Int J 2016;19:1582-92.
4. Carlisle EM. Silicon. In biochemistry of the essential ultratrace elements, Frieden E, editor. Boston, MA: Springer; 1984, pp. 257-91.
6. Avila DS, Puntel RL, Aschner M. Manganese in health and disease. Met Ions Life Sci 2013;13:199-227.
7. Tuschl K, Mills PB, Clayton PT. Chapter Twelve - manganese and the Brain, in international review of neurobiology, Bhatia KP, Schneider SA, editors. Cambridge: Academic Press; 2013, pp. 277-312.
8. Ahire JH, Chambrier I, Mueller A, Bao Y, Chao Y. Synthesis of D-mannose capped silicon nanoparticles and their interactions with MCF-7 human breast cancerous cells. ACS Appl Mater Interfaces 2013;5:7384-91.
9. Liu D, Mäkilä E, Zhang H, et al. Nanostructured porous silicon-solid lipid nanocomposite: towards enhanced cytocompatibility and stability, reduced cellular association, and prolonged drug release. Adv Funct Mater 2013;23:1893-902.
10. Kafshgari MH, Voelcker NH, Harding FJ. Applications of zero-valent silicon nanostructures in biomedicine. Nanomedicine 2015;10:2553-71.
11. Fântânariu M, Trincă LC, Solcan C, et al. A new Fe-Mn-Si alloplastic biomaterial as bone grafting material:
12. Trincă LC, Burtan L, Mareci D, et al. Evaluation of in vitro corrosion resistance and in vivo osseointegration properties of a FeMnSiCa alloy as potential degradable implant biomaterial. Mater Sci Eng C Mater Biol Appl 2021;118:111436.
13. Liu B, Zheng Y, Ruan L. In vitro investigation of Fe30Mn6Si shape memory alloy as potential biodegradable metallic material. Mater Lett 2011;65:540-3.
14. Rațoi M, Stanciu S, Cimpoeşu N, Cimpoeşu I, Constantin B, Paraschiv C. A potential biodegradable metallic material with shape memory effect based on iron. In structural integrity of welded structures, Murariu AC, editor. 2013. p. 110.
15. Drevet R, Zhukova Y, Kadirov P, et al. Tunable corrosion behavior of calcium phosphate coated Fe-Mn-Si alloys for bone implant applications. Metall Mat Trans A 2018;49:6553-60.
16. Drevet R, Zhukova Y, Malikova P, et al. Martensitic transformations and mechanical and corrosion properties of Fe-Mn-Si alloys for biodegradable medical implants. Metall Mat Trans A 2018;49:1006-13.
17. Prokoshkin S, Pustov Y, Zhukova Y, et al. Effect of thermomechanical treatment on structure and functional fatigue characteristics of biodegradable Fe-30Mn-5Si(wt %) shape memory alloy. Materials 2021;14:3327.
18. Babacan N, Kochta F, Hoffmann V, et al. Effect of silver additions on the microstructure, mechanical properties and corrosion behavior of biodegradable Fe-30Mn-6Si. Mater Today Commun 2021;28:102689.
19. Wang Y, Venezuela J, Dargusch M. Biodegradable shape memory alloys: progress and prospects. Biomaterials 2021;279:121215.
20. Del-río L, Nó M, Sota A, et al. Internal friction associated with ε martensite in shape memory steels produced by casting route and through additive manufacturing: influence of thermal cycling on the martensitic transformation. J Alloys Compd 2022;919:165806.
21. Ewald FC, Brenne F, Gustmann T, Vollmer M, Krooß P, Niendorf T. Laser powder bed fusion processing of Fe-Mn-Al-Ni shape memory alloy-on the effect of elevated platform temperatures. Metals 2021;11:185.
22. Ferretto I, Kim D, Della Ventura N, Shahverdi M, Lee W, Leinenbach C. Laser powder bed fusion of a Fe-Mn-Si shape memory alloy. Addit Manuf 2021;46:102071.
23. Kim D, Ferretto I, Jeon JB, Leinenbach C, Lee W. Formation of metastable bcc-δ phase and its transformation to fcc-γ in laser powder bed fusion of Fe-Mn-Si shape memory alloy. J Mater Res Technol 2021;14:2782-8.
24. Kim D, Ferretto I, Kim W, Leinenbach C, Lee W. Effect of post-heat treatment conditions on shape memory property in 4D printed Fe-17Mn-5Si-10Cr-4Ni shape memory alloy. Mater Sci Eng A 2022;852:143689.
25. Kim D, Ferretto I, Leinenbach C, Lee W. 3D and 4D printing of complex structures of Fe Mn Si-based shape memory alloy using laser powder bed fusion. Adv Mater Int 2022;9:2200171.
26. Niendorf T, Brenne F, Krooß P, et al. Microstructural evolution and functional properties of Fe-Mn-Al-Ni shape memory alloy processed by selective laser melting. Metall Mat Trans A 2016;47:2569-73.
27. Patriarca L, Abuzaid W, Carlucci G, Belelli F, Casati R. Pseudoelasticity in FeMnNiAl shape memory alloy lattice structures produced by Laser Powder Bed Fusion. Mater Lett 2021;302:130349.
28. Ferretto I, Borzì A, Kim D, et al. Control of microstructure and shape memory properties of a Fe-Mn-Si-based shape memory alloy during laser powder bed fusion. Addit Manuf Lett 2022;3:100091.
29. Niendorf T, Brenne F, Hoyer P, et al. Processing of new materials by additive manufacturing: iron-based alloys containing silver for biomedical applications. Metall Mat Trans A 2015;46:2829-33.
30. Wiesener M, Peters K, Taube A, et al. Corrosion properties of bioresorbable FeMn-Ag alloys prepared by selective laser melting. Mater Corros 2017;68:1028-36.
31. Mosallanejad MH, Niroumand B, Aversa A, Saboori A. In-situ alloying in laser-based additive manufacturing processes: a critical review. J Alloys Compd 2021;872:159567.
32. Carter LN, Martin C, Withers PJ, Attallah MM. The influence of the laser scan strategy on grain structure and cracking behaviour in SLM powder-bed fabricated nickel superalloy. J Alloys Compd 2014;615:338-47.
33. Yadroitsev I, Bertrand P, Smurov I. Parametric analysis of the selective laser melting process. Appl Surf Sci 2007;253:8064-9.
34. Krauss H, Zaeh M. Investigations on manufacturability and process reliability of selective laser melting. Phys Procedia 2013;41:815-22.
35. Yan X, Chang C, Dong D, et al. Microstructure and mechanical properties of pure copper manufactured by selective laser melting. Mater Sci Eng A 2020;789:139615.
36. Rietveld HM. Line profiles of neutron powder-diffraction peaks for structure refinement. Acta Cryst 1967;22:151-2.
37. Rietveld HM. A profile refinement method for nuclear and magnetic structures. J Appl Crystallogr 1969;2:65-71.
38. Will G. The rietveld method. In powder diffraction. Berlin Heidelberg: Springer; 2006, pp. 41-72.
40. Huang C, Ni H, Yen H. New protocol for orientation reconstruction from martensite to austenite in steels. Materialia 2020;9:100554.
41. Nishiyama Z, Crystallography of martensite (general). In martensitic transformation, Fine ME, editor. Cambridge: Academic Press; 1978, pp. 14-134.
42. Ansari MJ, Nguyen DS, Park HS. Investigation of SLM process in terms of temperature distribution and melting pool size: modeling and experimental approaches. Materials 2019;12:1272.
43. Li X, Kang C, Huang H, Zhang L, Sercombe T. Selective laser melting of an Al86Ni6Y4.5Co2La1.5 metallic glass: processing, microstructure evolution and mechanical properties. Mater Sci Eng A 2014;606:370-9.
44. Dong L, Makradi A, Ahzi S, Remond Y. Three-dimensional transient finite element analysis of the selective laser sintering process. J Mater Process Technol 2009;209:700-6.
45. Roberts I, Wang C, Esterlein R, Stanford M, Mynors D. A three-dimensional finite element analysis of the temperature field during laser melting of metal powders in additive layer manufacturing. Int J Mach Tools Manuf 2009;49:916-23.
46. Tsujimoto H, Kozaki S, Okutani Y, et al. Lifespan enhancement of crane rails, runway girders and overhead cranes using shape-memory alloyed fish-plates; 2017, pp. 72-80.
47. Cao B, Iwamoto T. An experimental investigation on rate dependency of thermomechanical and Stress-induced martensitic transformation behavior in Fe-28Mn-6Si-5Cr shape memory alloy under compression. Int J Impact Eng 2019;132:103284.
48. ASTM E92-16. Standard test methods for Vickers hardness and Knoop hardness of metallic materials. PA, USA: ASTM International; 2016.
49. Darvish K, Chen Z, Pasang T. Reducing lack of fusion during selective laser melting of CoCrMo alloy: effect of laser power on geometrical features of tracks. Mater Des 2016;112:357-66.
50. Carluccio D, Bermingham M, Kent D, Demir AG, Previtali B, Dargusch MS. Comparative study of pure iron manufactured by selective laser melting, laser metal deposition, and casting processes. Adv Eng Mater 2019;21:1900049.
51. Letenneur M, Brailovski V, Kreitcberg A, Paserin V, Bailon-Poujol I. Laser powder bed fusion of water-atomized iron-based powders: process optimization. J Manuf Mater Process 2017;1:23.
52. Liverani E, Toschi S, Ceschini L, Fortunato A. Effect of selective laser melting (SLM) process parameters on microstructure and mechanical properties of 316 L austenitic stainless steel. J Mater Process Technol 2017;249:255-63.
53. Wang D, Song C, Yang Y, Bai Y. Investigation of crystal growth mechanism during selective laser melting and mechanical property characterization of 316 L stainless steel parts. Mater Des 2016;100:291-9.
54. Nguyen Q, Zhu Z, Ng F, Chua B, Nai S, Wei J. High mechanical strengths and ductility of stainless steel 304 L fabricated using selective laser melting. J Mater Sci Technol 2019;35:388-94.
55. Kang N, Coddet P, Dembinski L, Liao H, Coddet C. Microstructure and strength analysis of eutectic Al-Si alloy in-situ manufactured using selective laser melting from elemental powder mixture. J Alloys Compd 2017;691:316-22.
56. Hou Y, Su H, Zhang H, Wang X, Wang C. Fabricating homogeneous FeCoCrNi high-entropy alloys via SLM in situ alloying. Metals 2021;11:942.
57. Haynes WM, Lide DR. CRC handbook of chemistry and physics. In CRC handbook of chemistry and physics, Haynes WM, Lide DR, editors. Cleveland, Ohio: CRC Press; 2017, pp. 97-126.
58. Chu J, Bao Y. Volatilization behavior of manganese from molten steel with different alloying methods in vacuum. Metals 2020;10:1348.
59. Yang C, Lin H, Lin K. Improvement of shape memory effect in Fe-Mn-Si alloy by slight tantalum addition. Mater Sci Eng A 2009;518:139-43.
60. Watson A, Markus T. Ternary system Fe-Mn-Si. In ternary steel systems: phase diagrams and phase transition data, Watson A, Markus T, editors. Berlin Heidelberg: Springer; 2015, pp. 121-33.
61. Tenbrock C, Fischer FG, Wissenbach K, et al. Influence of keyhole and conduction mode melting for top-hat shaped beam profiles in laser powder bed fusion. J Mater Process Technol 2020;278:116514.
62. Bauereiß A, Scharowsky T, Körner C. Defect generation and propagation mechanism during additive manufacturing by selective beam melting. J Mater Process Technol 2014;214:2522-8.
63. Madison JD, Aagesen LK. Quantitative characterization of porosity in laser welds of stainless steel. Scripta Materialia 2012;67:783-6.
64. He P, Webster RF, Yakubov V, et al. Fatigue and dynamic aging behavior of a high strength Al-5024 alloy fabricated by laser powder bed fusion additive manufacturing. Acta Mater 2021;220:117312.
65. DuPont JN. Fundamentals of weld solidification. In Welding Fundamentals and Processes. 2011; pp. 96-114.
66. Liu B, Li B, Li Z. Selective laser remelting of an additive layer manufacturing process on AlSi10Mg. Results Phys 2019;12:982-8.
67. Ghayoor M, Lee K, He Y, Chang C, Paul BK, Pasebani S. Selective laser melting of 304 L stainless steel: role of volumetric energy density on the microstructure, texture and mechanical properties. Addit Manuf 2020;32:101011.
68. Pham MS, Dovgyy B, Hooper PA, Gourlay CM, Piglione A. The role of side-branching in microstructure development in laser powder-bed fusion. Nat Commun 2020;11:749.
69. Lippold JC. Welding metallurgy principles. In welding metallurgy and weldability; 2014. pp. 9-83.
70. Zhang X, Yocom CJ, Mao B, Liao Y. Microstructure evolution during selective laser melting of metallic materials: a review. J Laser Appl 2019;31:031201.
71. Bertoli U, Macdonald BE, Schoenung JM. Stability of cellular microstructure in laser powder bed fusion of 316 L stainless steel. Mater Sci Eng A 2019;739:109-17.
72. Pinomaa T, Lindroos M, Walbrühl M, Provatas N, Laukkanen A. The significance of spatial length scales and solute segregation in strengthening rapid solidification microstructures of 316 L stainless steel. Acta Mater 2020;184:1-16.
73. Li Y, Gu D. Parametric analysis of thermal behavior during selective laser melting additive manufacturing of aluminum alloy powder. Mater Des 2014;63:856-67.
74. Chen Y, Chen H, Chen J, Xiong J, Wu Y, Dong S. Numerical and experimental investigation on thermal behavior and microstructure during selective laser melting of high strength steel. J Manuf Process 2020;57:533-42.
75. Jung HY, Choi SJ, Prashanth KG, et al. Fabrication of Fe-based bulk metallic glass by selective laser melting: a parameter study. Mater Des 2015;86:703-8.
76. Suryawanshi J, Prashanth K, Scudino S, Eckert J, Prakash O, Ramamurty U. Simultaneous enhancements of strength and toughness in an Al-12Si alloy synthesized using selective laser melting. Acta Mater 2016;115:285-94.
77. Prashanth K, Eckert J. Formation of metastable cellular microstructures in selective laser melted alloys. J Alloys Compd 2017;707:27-34.
78. Guan J, Jiang Y, Zhang X, Chong X. Microstructural evolution and EBSD analysis of AlSi10Mg alloy fabricated by selective laser remelting. Mater Charact 2020;161:110079.
79. Xiong Z, Zhang P, Tan C, Dong D, Ma W, Yu K. Selective laser melting and remelting of pure tungsten. Adv Eng Mater 2020;22:1901352.
80. Herzog D, Seyda V, Wycisk E, Emmelmann C. Additive manufacturing of metals. Acta Mater 2016;117:371-92.
81. Debroy T, Wei H, Zuback J, et al. Additive manufacturing of metallic components - process, structure and properties. Prog Mater Sci 2018;92:112-224.
82. Rafi HK, Karthik NV, Gong H, Starr TL, Stucker BE. Microstructures and mechanical properties of Ti6Al4V Parts fabricated by selective laser melting and electron beam melting. J Mater Eng Perform 2013;22:3872-83.
83. Trevisan F, Calignano F, Lorusso M, et al. On the selective laser melting (SLM) of the AlSi10Mg alloy: process, microstructure, and mechanical properties. Materials 2017;10:76.
84. Spierings A, Dawson K, Dumitraschkewitz P, Pogatscher S, Wegener K. Microstructure characterization of SLM-processed Al-Mg-Sc-Zr alloy in the heat treated and HIPed condition. Addit Manuf 2018;20:173-81.
85. Cao S, Zou Y, Lim CVS, Wu X. Review of laser powder bed fusion (LPBF) fabricated Ti-6Al-4V: process, post-process treatment, microstructure, and property. Light Adv Manuf 2021;2.
86. Nigito E, Diemer F, Husson S, Ou S, Tsai M, Rézaï-aria F. Microstructure of NiTi superelastic alloy manufactured by selective laser melting. Mater Lett 2022;324:132665.
87. Attard B, Cruchley S, Beetz C, Megahed M, Chiu Y, Attallah M. Microstructural control during laser powder fusion to create graded microstructure Ni-superalloy components. Addit Manuf 2020;36:101432.
88. Li X, Tan W. Numerical investigation of effects of nucleation mechanisms on grain structure in metal additive manufacturing. Comput Mater Sci 2018;153:159-69.
89. Antonysamy A, Meyer J, Prangnell P. Effect of build geometry on the β-grain structure and texture in additive manufacture of Ti6Al4V by selective electron beam melting. Mater Charact 2013;84:153-68.
90. Mohebbi MS, Ploshikhin V. Implementation of nucleation in cellular automaton simulation of microstructural evolution during additive manufacturing of Al alloys. Addit Manuf 2020;36:101726.
91. Yan F, Xiong W, Faierson EJ. Grain structure control of additively manufactured metallic materials. Materials 2017;10:1260.
92. Yang M, Wang L, Yan W. Phase-field modeling of grain evolutions in additive manufacturing from nucleation, growth, to coarsening. NPJ Comput Mater 2021:7.
93. Ikeda T, Yonehara M, Ikeshoji T, et al. Influences of process parameters on the microstructure and mechanical properties of CoCrFeNiTi based high-entropy alloy in a laser powder bed fusion process. Crystals 2021;11:549.
94. Liu D, Wang S, Yan W. Grain structure evolution in transition-mode melting in direct energy deposition. Mater Des 2020;194:108919.
95. Chlebus E, Gruber K, Kuźnicka B, Kurzac J, Kurzynowski T. Effect of heat treatment on the microstructure and mechanical properties of Inconel 718 processed by selective laser melting. Mater Sci Eng A 2015;639:647-55.
96. Ali H, Ghadbeigi H, Mumtaz K. Effect of scanning strategies on residual stress and mechanical properties of Selective Laser Melted Ti6Al4V. Mater Sci Eng A 2018;712:175-87.
97. Chen C, Yin J, Zhu H, Xiao Z, Zhang L, Zeng X. Effect of overlap rate and pattern on residual stress in selective laser melting. Int J Mach Tools Manuf 2019;145:103433.
98. Acharya R, Sharon JA, Staroselsky A. Prediction of microstructure in laser powder bed fusion process. Acta Mater 2017;124:360-71.
99. Liu P, Wang Z, Xiao Y, Horstemeyer MF, Cui X, Chen L. Insight into the mechanisms of columnar to equiaxed grain transition during metallic additive manufacturing. Addit Manuf 2019;26:22-9.
100. Wang T, Zhu Y, Zhang S, Tang H, Wang H. Grain morphology evolution behavior of titanium alloy components during laser melting deposition additive manufacturing. J Alloys Compd 2015;632:505-13.
101. Ozcan H, Ma J, Wang S, et al. Effects of cyclic heat treatment and aging on superelasticity in oligocrystalline Fe-Mn-Al-Ni shape memory alloy wires. Scripta Mater 2017;134:66-70.
102. Vollmer M, Krooß P, Kriegel M, et al. Cyclic degradation in bamboo-like Fe-Mn-Al-Ni shape memory alloys - the role of grain orientation. Scripta Mater 2016;114:156-60.
103. Ueland SM, Chen Y, Schuh CA. Oligocrystalline shape memory alloys. Adv Funct Mater 2012;22:2094-9.
104. Abbaschian R, Abbaschian L, Reed-Hill RE. Elements of grain boundaries. In physical metallurgy principles, Stamford, CT: Cengage learning; 2009, pp. 158-93.
105. Callister WD, Rethwisch DG. Dislocations and strengthening mechanisms. In materials science and engineering: an introduction. Hoboken, NJ: Wiley; 2014, pp. 216-50.
106. Xu Z, Hodgson MA, Cao P. A comparative study of powder metallurgical (PM) and wrought Fe-Mn-Si alloys. Mater Sci Eng A 2015;630:116-24.
107. Fiocchi J, Lemke J, Zilio S, Biffi C, Coda A, Tuissi A. The effect of Si addition and thermomechanical processing in an Fe-Mn alloy for biodegradable implants: mechanical performance and degradation behavior. Mater Today Commun 2021;27:102447.
108. Bergeon N, Guenin G, Esnouf C. Microstructural analysis of the stress-induced ε martensite in a Fe-Mn-Si-Cr-Ni shape memory alloy: Part I—calculated description of the microstructure. Mater Sci Eng A 1998;242:77-86.
109. Gu Q, Van Humbeeck J, Delaey L. A review on the martensitic transformation and shape memory effect in Fe-Mn-Si alloys. J Phys 1994;04:C3-135.
110. Putaux JL, Chevalier JP. HREM study of self-accommodated thermal ε-martensite in an F-Mn-Si-Cr-Ni shape memory alloy. Acta Mater 1996;44:1701-16.
111. Jang W, Kang J, Jeeb K, Shinb M, Hong J. The effects of grain size and transformation texture on the shape memory effect in Fe-15Mn-5Cr-5Co-3Si alloy. In Ecomaterials, Yamamoto R, editor. Elsevier. 1994; pp. 993-6.
112. Käfer KA, Bernardi HH, Santos ODS, Otubo L, Lima NBD, Otubo J. The influence of microstructure and mechanical resistance on the shape memory of ecae processed stainless Fe-Mn-Si-Cr-Ni-Co steel. Mat Res 2018:21.
113. Onuki Y, Fujieda S, Shinoda K, Ohtani H, Maruyama T, Suzuki S. Depletion of manganese in the surface layers of Fe-Mn-Si shape memory alloys by annealing. Defect Diffus Forum 2015;363:196-201.
114. Callister WD, Rethwisch DG. Imperfections in solids. In materials science and engineering: an introduction. Hoboken, NJ: Wiley; 2018, pp. 92-120.
115. Feng YP, Blanquer A, Fornell J, et al. Novel Fe-Mn-Si-Pd alloys: insights into mechanical, magnetic, corrosion resistance and biocompatibility performances. J Mater Chem B 2016;4:6402-12.
116. Spandana D, Desai H, Chakravarty D, Vijay R, Hembram K. Fabrication of a biodegradable Fe-Mn-Si alloy by field assisted sintering. Adv Powder Technol 2020;31:4577-84.
117. Eskil M, Kanca E. A new formulation for martensite start temperature of Fe-Mn-Si shape memory alloys using genetic programming. Comput Mater Sci 2008;43:774-84.
118. Hsu T, Zuyao X. Martensitic transformation in Fe-Mn-Si based alloys. Mater Sci Eng A 1999;273-275:494-7.
119. Balo ŞN. A comparative study on crystal structure and magnetic properties of Fe-Mn-Si and Fe-Mn-Si-Cr Alloys. J Supercond Nov Magn 2013;26:1085-8.
120. Tomota Y, Strum M, Morris JW. Microstructural dependence of Fe-high Mn tensile behavior. Metall Trans A 1986;17:537-47.
121. Zaefferer S, Elhami N, Konijnenberg P. Electron backscatter diffraction (EBSD) techniques for studying phase transformations in steels. In phase transformations in steels, Pereloma E, Edmonds DV, editor. Woodhead Publishing; 2012, pp. 557-87.
122. Roberts G, Ward RM, Strangwood M, Davis CL. Use of misorientation values to further understand deformation in rail steels. Ironmak Steelmak 2013;40:92-7.
123. Wright SI, Nowell MM, Field DP. A review of strain analysis using electron backscatter diffraction. Microsc Microanal 2011;17:316-29.
124. Brewer LN, Field DP, Merriman CC. Mapping and assessing plastic deformation using EBSD. In electron backscatter diffraction in materials science, Schwartz AJ, editor. Boston, MA: Springer; 2009, pp. 251-62.
125. Hou J, Peng Q, Shoji T, Wang J, Han E, Ke W. Effects of cold working path on strain concentration, grain boundary microstructure and stress corrosion cracking in Alloy 600. Corros Sci 2011;53:2956-62.
126. Hu X, Chai L, Zhu Y, et al. Quantitative study of microstructural, textural and hardness evolution of high-purity Ti sheet during rolling from low to medium strains. Mater Today Commun 2021;29:102989.
127. Qiao D, Zhang W, Pan T, Crooker P, David S, Feng Z. Evaluation of residual plastic strain distribution in dissimilar metal weld by hardness mapping. Sci Technol Weld Join 2013;18:624-30.
128. Fukui D, Nakada N, Onaka S. Internal residual stress originated from Bain strain and its effect on hardness in Fe-Ni martensite. Acta Mater 2020;196:660-8.
129. Mercelis P, Kruth J. Residual stresses in selective laser sintering and selective laser melting. Rap Prototyp J 2006;12:254-65.
130. Vrancken B, Cain V, Knutsen R, Van Humbeeck J. Residual stress via the contour method in compact tension specimens produced via selective laser melting. Scripta Mater 2014;87:29-32.
131. Lu L, Wu C, Wang J, Liu Y, Tu H, Su X. Experimental investigation and thermodynamic calculation of the Zn-Fe-Ce system. J Alloys Compd 2015;648:881-9.
132. Liu Y, Yang Y, Wang D. A study on the residual stress during selective laser melting (SLM) of metallic powder. Int J Adv Manuf Technol 2016;87:647-56.
Cite This Article
Export citation file: BibTeX | RIS
OAE Style
Dela Cruz ML, Yakubov V, Li X, Ferry M. Microstructure evolution in laser powder bed fusion-built Fe-Mn-Si shape memory alloy. Microstructures 2023;3:2023012. http://dx.doi.org/10.20517/microstructures.2022.33
AMA Style
Dela Cruz ML, Yakubov V, Li X, Ferry M. Microstructure evolution in laser powder bed fusion-built Fe-Mn-Si shape memory alloy. Microstructures. 2023; 3(2): 2023012. http://dx.doi.org/10.20517/microstructures.2022.33
Chicago/Turabian Style
Dela Cruz, Michael Leo, Vladislav Yakubov, Xiaopeng Li, Michael Ferry. 2023. "Microstructure evolution in laser powder bed fusion-built Fe-Mn-Si shape memory alloy" Microstructures. 3, no.2: 2023012. http://dx.doi.org/10.20517/microstructures.2022.33
ACS Style
Dela Cruz, ML.; Yakubov V.; Li X.; Ferry M. Microstructure evolution in laser powder bed fusion-built Fe-Mn-Si shape memory alloy. Microstructures. 2023, 3, 2023012. http://dx.doi.org/10.20517/microstructures.2022.33
About This Article
Copyright

Data & Comments
Data
0

 Cite This Article 8 clicks

 Like This Article 2
likes
Like This Article 2
likes


Comments
Comments must be written in English. Spam, offensive content, impersonation, and private information will not be permitted. If any comment is reported and identified as inappropriate content by OAE staff, the comment will be removed without notice. If you have any queries or need any help, please contact us at support@oaepublish.com.