
The effect of chromium content on the corrosion behavior of ultrafine-grained CrxMnFeCoNi high-entropy alloys in sulfuric acid solution
 0
0Abstract
Chromium (Cr) plays a critical role in the corrosion resistance of conventional alloys via the formation of a dense Cr oxide-based passive film. However, the exact role of Cr in the corrosion of high-entropy alloys (HEAs) remains unclear. The effect of Cr content on the corrosion behavior of the ultrafine-grained CrxMnFeCoNi (x = 0, 0.6, 1, and 1.5) HEAs in the sulfuric acid solution (0.5 M H2SO4) was investigated. These HEAs were fabricated using a combination of mechanical alloying and spark plasma sintering. The electrochemical tests show that the passive film was more compact and thicker at higher Cr concentration, but the corrosion rate first increased and then decreased, due to the presence of the nanocrystalline-amorphous phase boundaries in the passive film. Long-time immersion tests show that the corrosion rate increased exponentially with the Cr content, due to the gradual accumulation of the galvanic corrosion.
Keywords
INTRODUCTION
High-entropy alloys (HEAs) have been reported with excellent mechanical properties at cryogenic temperatures[1-3] and high resistance to wear[4], irradiation[5] and corrosion[6,7], and are thus considered to be promising candidates in extreme structural applications[8]. Among the HEAs, face-centered-cubic (fcc) CoCrFeMnNi HEA is of particular interest due to its excellent combination of high strength-ductility-toughness at cryogenic temperature[9-11]. For example, Gludovatz et al. reported that the CrMnFeCoNi HEA showed remarkable fracture toughness at cryogenic temperatures down to 77 K, comparable to the austenitic stainless steels and high Ni steels[10]. Such HEA and its sub-family generally have high Cr content, much above the required amount (12 at.%) to obtain “stainless” behavior on the surface for conventional corrosion-resistant alloys, such as stainless steel and nickel-based alloys[12], and thus, are expected to have superior corrosion resistance.
The mechanism of Cr to enhance the corrosion resistance of alloys is through the formation of a dense Cr oxide-based passive film[13,14], which serves as an effective barrier on an alloy across a wide range of pH[15]. There have been numerous reports on the corrosion behaviors of CoCrFeNi-based HEAs in recent few years[16-22]. Ye et al. found that the CrMnFeCoNi HEA coating showed nobler corrosion potential (Ecorr) and lower corrosion current (Icorr) derived from the potentiodynamic polarization tests than 304 stainless steel (304SS) in a 0.5 M H2SO4 solution[21]. The AlCoCuFeNiCr HEA immersed in sulfuric acid solution showed better corrosion resistance than the Cr-free HEA, attributing to the formation of the compact Cr2O3 passive film on the surface[17]. However, the corrosion resistance of CrMnFeCoNi HEA was inferior when compared with 304 L stainless steel in a 0.1 M H2SO4 solution, because the passive film on the CrMnFeCoNi HEA was very unstable due to the low content of Cr and the extensive formation of metal hydroxide in the passive film[22]. Similar phenomena were also observed in several Cr-containing HEA systems, such as AlCoCrFeNi[18,19] and FeCoNiCrCux HEAs[20]. For these HEAs, the distribution of Cr element in the matrix is relatively inhomogeneous and the Cr-depleted phase as anode would become a sensitive site to induce the formation of pitting. As a result, the general corrosion rate would be accelerated by the galvanic corrosion effect. Even with the same composition system of CoCrFeMnNi HEA, distinct corrosion behavior was observed[21-24]. Wang et al. found that the oxide film on HEA was duplex, comprising a Cr/Mn inner oxide layer and a Cr/Fe/Co outer oxide/hydroxide layer[25]. For now, the effect of Cr content on the corrosion mechanism in the HEAs has not been unraveled in detail. The matrix structure, composition, and the competing effect of the passive film and the pitting on the corrosion behavior can be revealed by exploring the Cr-containing HEAs with varying Cr concentrations.
In this work, the corrosion behavior of the CrxMnFeCoNi (x = 0, 0.6, 1, and 1.5, respectively) HEAs with varying Cr concentrations in a 0.5 M H2SO4 solution was investigated. The matrix microstructure was characterized using X-ray diffraction (XRD), scanning electron microscopy (SEM) and transmission electron microscopy (TEM) in detail. Moreover, the corrosion behavior of the CrxMnFeCoNi HEAs was examined using the potentiodynamic polarization tests and the electrochemical impendence spectroscope (EIS), along with the static immersion tests. Then, the corroded surface was analyzed using SEM, TEM, atomic force microscope (AFM) and X-ray photoelectron spectroscopy (XPS). Our main objective is to give an in-depth understanding of the effect of Cr on the corrosion behavior of the CrxMnFeCoNi HEAs in sulfuric solution.
EXPERIMENTAL PROCEDURE
Alloy fabrication
The CrxMnFeCoNi (x = 0, 0.6, 1, and 1.5) HEAs (hereafter denoted as Cr0, Cr0.6, Cr1, Cr1.5, respectively) were prepared using commercially pure (99.9 wt.%) elemental powder of Cr, Mn, Fe, Co and Ni as the starting material. The powder mixture was put into a stainless steel vial with a ball-to-powder mass ratio of 5:1 and subjected to high-energy ball milling for 9 h using a SPEX 8000D mill at ambient temperature in an argon glovebox. The ball-milled powders were consolidated by spark plasma sintering (SPS-211Lx, Fujidempa Kogyo. Co., Ltd, Japan) at 950 °C for 5 min under a pressure of 45 MPa in vacuum condition
The sintered cylindrical HEAs were cut into discs using electrical discharge machining for subsequent characterization and tests. For electrochemical tests, the samples were cut into discs with a size of
Microstructure characterization of the as-sintered HEAs
The phase of the as-sintered CrxMnFeCoNi (x = 0, 0.6, 1, and 1.5) HEAs was identified using XRD patterns recorded on a Rigaku Smartlab-9KW diffractometer with Cu-Kα radiation (45 kV, 200 mA). The data were collected with 2θ in the range of 30° to 80° with a step size of 0.02° at a scanning speed of 10°/min. The surface morphology and composition were examined using SEM (TESCAN MIRA 3, Czech Republic) coupled with energy-dispersive X-ray spectroscopy (EDS). Electron backscatter diffraction (EBSD) was performed to characterize the grain structure of the HEAs. TEM (FEI Tecnai F30, USA) and high-angle annular dark-field scanning TEM (HAADF-STEM) were used to characterize the microstructure of the as-sintered HEAs. The TEM samples were prepared using site-specific focused ion beam (FIB; FEI Helios Nano LabTM 600i) lift-out technique. Besides, platinum cap layers with a thickness of ~1 μm were deposited before milling the trench to protect the surface.
Electrochemical corrosion and immersion tests
Electrochemical measurements were performed in a 0.5 M H2SO4 solution at ambient temperature using a Princeton Applied Research Versa Studio (PARSTAT 4000A, Ametek Scientific Instruments, USA). A standard three-electrode cell system was performed during all the measurements using a platinum sheet as the counter electrode, a saturated calomel electron (SCE) as the reference electrode and the CrxMnFeCoNi HEAs as the working electrode. Before EIS and potentiodynamic polarization tests, the specimens were subjected to the potentiostatic polarization at -0.6 V vs. SCE for 5 min to remove the surface oxidation, and then the open-circuit potential (OCP) was measured for 2 h in order to obtain a steady or quasi-steady potential value. EIS tests were performed at OCP with the sinusoidal potential amplitude of 10 mV in the frequency range from 100 kHz to 10 mHz. The data derived from EIS tests were fitted and analyzed using the Zsimpwin software. Then, the potentiodynamic polarization tests were conducted with the scanning range from -0.25 V vs. OCP to 1.3 V vs. SCE at a scan rate of 1 mV/s. Each electrochemical test was performed three times to confirm the reproducibility of the results.
The static immersion tests were performed in 0.5 M H2SO4 at ambient temperature for 15 days. Three parallel experiments were performed for each HEA. The average corrosion rate by mass loss Cw in mm/y was calculated using the following Eq. (1):
where k is the constant of 8.76 × 10⁴, ∆W is the mass loss (g) after the immersion test, A is the surface area (cm2), t is the immersion time (h), and ρ is the density (g/cm3) of the sample, measured by Archimedes method.
Corroded morphology and composition characterization
The corroded surface morphology was examined using SEM and AFM (Dimension edge, Bruker Corporation, Germany). The surface composition was analyzed using EDS and XPS (Thermo Scientific
RESULTS
Phase, composition and microstructure of the as-sintered HEAs
The measured density of all the sintered CrxMnFeCoNi HEAs exceeds ~ 98%. Very few pores were located on the surface [Figure 1A-D], confirming the high density of the HEAs. Some randomly distributed tiny dark spots were found on the surface. EDS line scanning profiles [Supplementary Figure 1] show that such dark spots are rich in Cr, Mn and O. EDS elemental maps [Figure 1] show the uniform distribution of Co, Fe, Mn and Ni, while Cr shows segregation and inhomogeneity. With a higher concentration of Cr, the
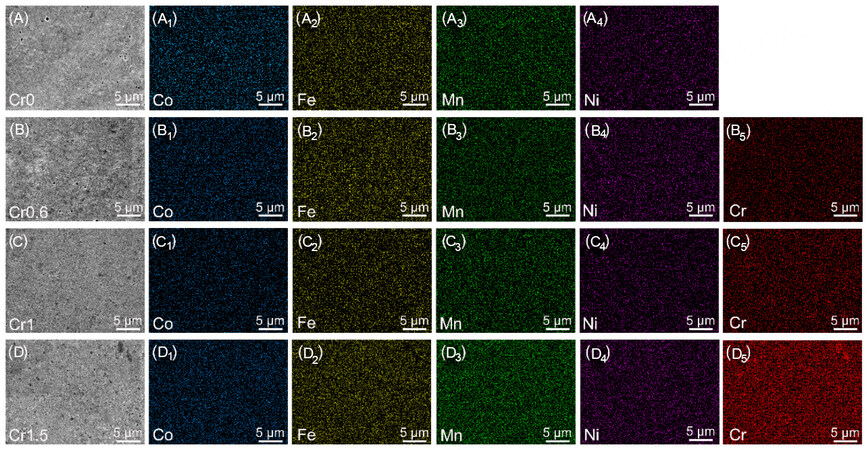
Figure 1. Surface morphology and EDS elemental maps of the as-sintered CrxMnFeCoNi (x = 0, 0.6, 1, and 1.5) HEAs. (A-A4) Cr0; (B-B5) Cr0.6; (C-C5) Cr1; and (D-D5) Cr1.5. EDS: Energy-dispersive X-ray spectroscopy; HEAs: high-entropy alloys.
Quantitative EDS analysis (in atomic percentage) for the as-sintered CrxMnFeCoNi (x = 0, 0.6, 1, and 1.5) HEAs
| Sample | Co | Fe | Mn | Ni | Cr |
| Cr0 | 25.0 | 25.4 | 25.0 | 24.6 | - |
| Cr0.6 | 21.7 | 21.7 | 22.3 | 21.1 | 13.2 |
| Cr1 | 19.4 | 20.3 | 20.2 | 19.7 | 20.4 |
| Cr1.5 | 18.1 | 18.2 | 18.4 | 18.1 | 27.2 |
XRD patterns of the CrxMnFeCoNi HEAs [Figure 2] show that the spark-plasma-sintered HEAs have a dominant fcc matrix phase with a trace amount of (Cr, Mn)Ox oxides owing to the relatively low vacuum during the sintering process and the high chemical activity of Cr and Mn. The oxide phase content increases with the Cr concentration. The XRD patterns confirmed that the tiny dark particles found on the surface were oxides. EBSD inverse pole figure (IPF) maps [Figure 3] show that the CrxMnFeCoNi HEAs have equi-axed grain structure and very similar average grain size, in the range of 312 to 360 nm. Furthermore, TEM-based techniques were used to characterize the microstructure in more detail. The HAADF-STEM image
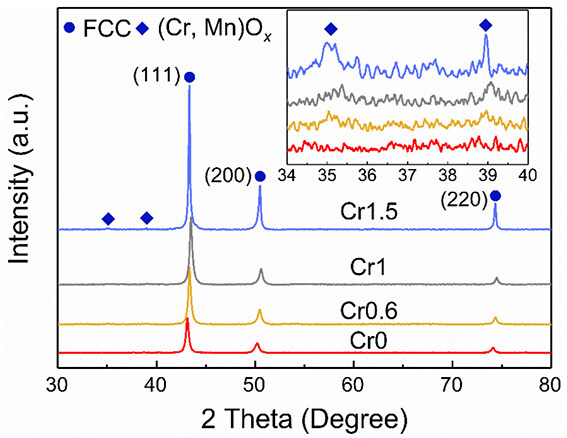
Figure 2. XRD patterns of the CrxMnFeCoNi (x = 0, 0.6, 1, and 1.5) HEAs. XRD: X-ray diffraction; HEAs: high-entropy alloys.
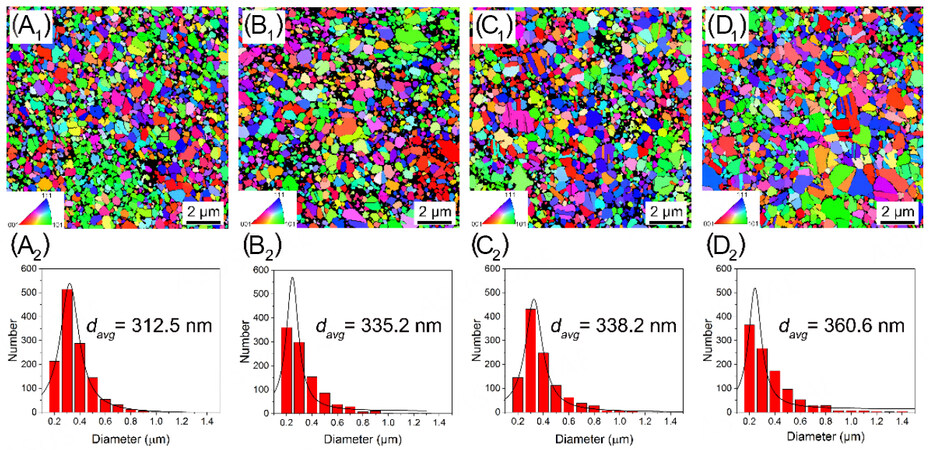
Figure 3. EBSD IPF maps and the average grain size distribution of the as-sintered CrxMnFeCoNi (x = 0, 0.6, 1, and 1.5) HEAs. (A) Cr0, (B) Cr0.6, (C) Cr1 and (D) Cr1.5. EBSD: Electron backscatter diffraction; IPF: inverse pole figure; HEAs: high-entropy alloys.
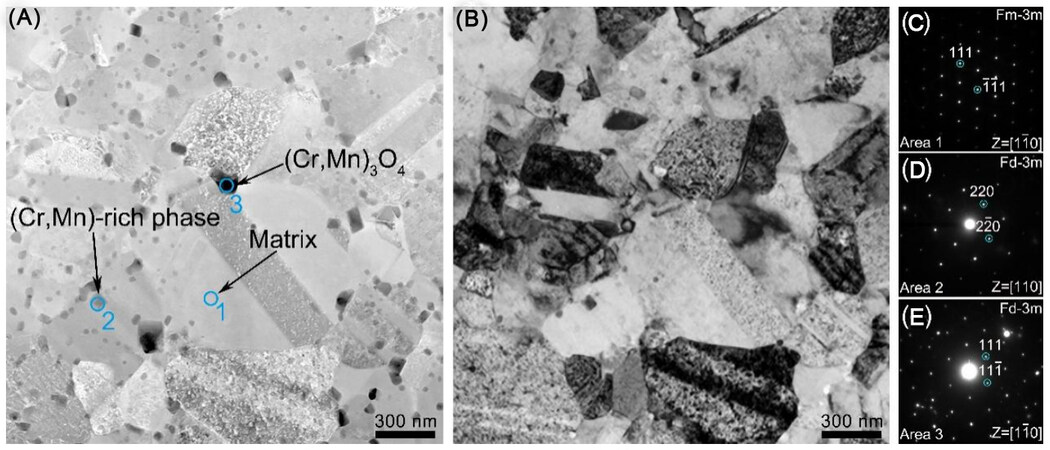
Figure 4. TEM characterization of the as-sintered CrMnFeCoNi (Cr1, x = 1) HEA. (A and B) are HAADF-STEM and corresponding bright-field TEM images; (C-E) are SAED patterns of the matrix, the grey precipitate and the black precipitate in (A), respectively. TEM: Transmission electron microscopy; HEA: high-entropy alloy; HAADF-STEM: high-angle annular dark-field scanning TEM; SAED: selected area electron diffraction.
Quantitative EDS analysis (in atomic percentage) of Cr1 HEA in Figure 4A
| Point | O | Cr | Mn | Fe | Co | Ni |
| 1 | - | 16.3 | 21.3 | 21.6 | 19.8 | 21.0 |
| 2 | 10.4 | 26.4 | 22.1 | 13.4 | 13.3 | 14.4 |
| 3 | 47.3 | 31.1 | 21.6 | - | - | - |
Potentiodynamic polarization
Figure 5 shows the potentiodynamic polarization curves of CrxMnFeCoNi HEAs in a 0.5 M H2SO4 at room temperature. The values of Ecorr and Icorr derived from the polarization curves were included in Table 3. With the increase of the Cr concentration, the Ecorr shows more negative value from -0.40 V to -0.45 V, which suggests a more severe corrosion tendency, but not the actual corrosion rate at the moment in terms of kinetics[27,28]. The increment in the corrosion sensitivity may be due to the presence of more Cr-rich phases and the oxides precipitated in the matrix. In comparison with the CoFeMnNi HEA (Cr0) in the absence of the Cr, the Icorr of Cr0.6 HEA first increases and then gradually decreases with the increasing Cr concentration. The Cr0.6 HEA shows the highest Icorr of 5.36 μA/cm2 and the Cr1.5 HEA shows the lowest
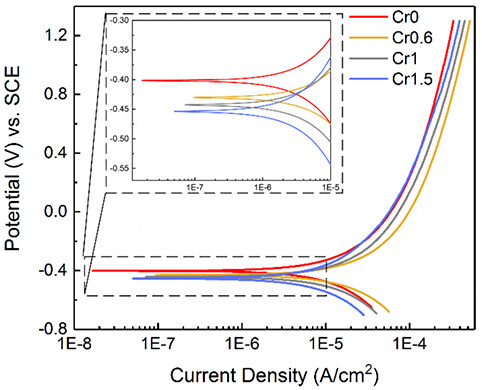
Figure 5. Potentiodynamic polarization curves of the as-sintered CrxMnFeCoNi (x = 0, 0.6, 1, and 1.5) HEAs in a 0.5 M H2SO4 solution at room temperature.
Polarization parameters and equivalent circuit parameters for EIS of CrxMnFeCoNi (x = 0, 0.6, 1 and 1.5) HEAs in a
| Sample | Ecorr/V | Icorr/μA/cm2 | Yp/S·cm-2·sn | np | Rp/Ω·cm2 | chsq |
| Cr0 | -0.40 ± 0.01 | 4.20 ± 0.08 | 2.60E-08 | 0.74 | 6113 | 2.28E-04 |
| Cr0.6 | -0.41 ± 0.03 | 5.36 ± 1.05 | 1.25E-08 | 0.79 | 3510 | 1.47E-04 |
| Cr1 | -0.44 ± 0.01 | 3.33 ± 1.61 | 9.35E-09 | 0.84 | 5506 | 1.85E-04 |
| Cr1.5 | -0.45 ± 0.01 | 2.75 ± 1.41 | 1.11E-08 | 0.82 | 7715 | 5.73E-04 |
Surface morphology and composition after polarization tests
After potentiodynamic polarization tests in the 0.5 M H2SO4 solution at room temperature, the
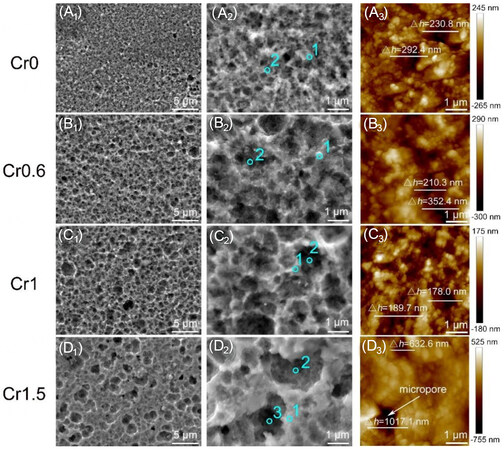
Figure 6. Surface morphology (A1-D1, A2-D2) and AFM height images (A3-D3) of the CrxMnFeCoNi (x = 0, 0.6, 1, and 1.5) HEAs after polarization tests in a 0.5 M H2SO4 solution at room temperature.
Quantitative EDS analysis on the honeycomb-like surface of CrxMnFeCoNi HEAs [Figure 6A2-D2] is included in Table 4. Inside the pores, all the four groups of HEAs have reduced content of Fe, Co and Ni but increased O, suggesting the selective dissolution of the elements Fe, Co and Ni and the formation of oxide films occurred simultaneously during the corrosion process. It is noted that the peak positions (point 1, Figure 6D2) of the Cr1.5 HEA surface contain a much higher content of O, indicating a better passivation effect on the region outside the micropores. However, the content of O in the deep valley of the pores
Quantitative EDS analysis (in atomic percentage) on the corroded surface of CrxMnFeCoNi (x = 0, 0.6, 1, and 1.5) HEAs in Figure 6
| Sample | Point | O | Cr | Mn | Fe | Co | Ni |
| Cr0 | (a2)-1 | - | - | 24.8 | 25.0 | 25.6 | 24.6 |
| (a2)-2 | 8.3 | - | 24.0 | 23.4 | 23.3 | 21.0 | |
| Cr0.6 | (b2)-1 | 5.9 | 12.5 | 20.3 | 20.6 | 20.2 | 20.5 |
| (b2)-2 | 14.2 | 14.9 | 20.0 | 17.3 | 16.5 | 17.1 | |
| Cr1 | (c2)-1 | - | 20.3 | 19.9 | 20.3 | 20.1 | 19.4 |
| (c2)-2 | 13.5 | 18.0 | 17.7 | 17.2 | 17.0 | 16.6 | |
| Cr1.5 | (d2)-1 | 16.0 | 24.6 | 16.8 | 14.5 | 13.6 | 14.5 |
| (d2)-2 | 7.1 | 27.6 | 18.0 | 16.0 | 15.6 | 15.7 | |
| (d2)-3 | 2.4 | 34.0 | 23.8 | 14.7 | 12.8 | 12.3 |
XPS was performed to identify the chemical state of the corrosion products on the corroded surface of
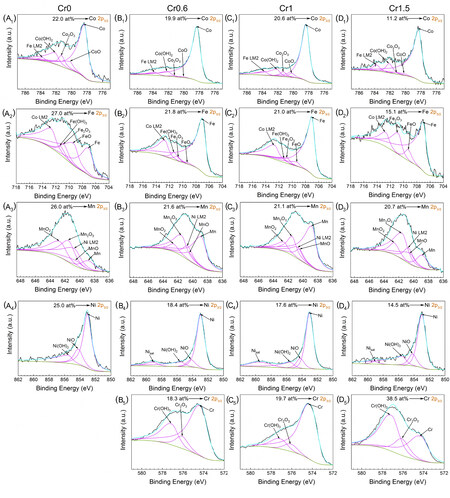
Figure 7. High-resolution XPS spectra of the corroded surface on Cr0 (A1-A4), Cr0.6 (B1-B5), Cr1 (C1-C5), and Cr1.5 (D1-D5) HEAs after polarization in a 0.5 M H2SO4 solution at room temperature. (A1-D1) Co 2p3/2; (A2-D2) Fe 2p3/2; (A3-D3) Mn 2p3/2; (A4-D4) Ni 2p3/2; and (B5-D5) Cr 2p3/2. XPS: X-ray photoelectron spectroscopy.
The quantitative analysis (in atomic percentage) of the XPS spectra of the corroded surface on Cr0, Cr0.6, Cr1 and Cr1.5 in Figure 7
| Spectrum | Substance | Cr0 | Cr0.6 | Cr1 | Cr1.5 |
| Co 2p3/2 | Co | 13.4 | 17.6 | 15.6 | 9.0 |
| CoO | 2.8 | 0.2 | 0.9 | 0.9 | |
| Co2O3 | 2.1 | 0.2 | 1.1 | 0.2 | |
| Co(OH)2 | 3.7 | 1.9 | 3.0 | 1.1 | |
| Fe 2p3/2 | Fe | 10.1 | 19.3 | 16.2 | 10.2 |
| FeO | 11.0 | 0.3 | 1.6 | 1.1 | |
| Fe2O3 | 3.6 | 0.7 | 2.0 | 3.8 | |
| Fe(OH)3 | 2.3 | 1.3 | 1.2 | - | |
| Mn 2p3/2 | Mn | 3.8 | 11.0 | 12.4 | 3.6 |
| MnO | 3.4 | 2.1 | 2.1 | 4.2 | |
| Mn2O3 | 10.1 | 6.8 | 4.2 | 10.0 | |
| MnO2 | 8.7 | 1.9 | 2.4 | 2.9 | |
| Ni 2p3/2 | Ni | 15.1 | 13.4 | 12.7 | 8.4 |
| NiO | 4.6 | 1.8 | 2.2 | 1.8 | |
| Ni(OH)2 | 5.3 | 3.2 | 2.7 | 4.3 | |
| Cr 2p3/2 | Cr | - | 12.1 | 15.7 | 13.7 |
| Cr2O3 | - | 1.8 | 2.6 | 18.4 | |
| Cr(OH)3 | - | 4.4 | 1.4 | 6.4 |
Compared with Cr0 HEA in the absence of Cr, the Cr0.6 HEA shows significantly reduced content of Fe and Mn oxides/hydroxides in the oxide film, which thus shows weaker corrosion resistance. Likewise, as the Cr concentration increases from Cr 0.6 to Cr1.5, the increased amount of oxide/hydroxide of Cr, Mn and Fe provides denser and more protective oxide film for Cr1.5 HEA than Cr0.6 and Cr1 HEAs. However, the enrichment of Mn in the oxide film could degrade the stability of the passive film[31], which could lead to the breakdown of the oxide film in the local region of the Cr1.5 HEA during severe corrosion. On the whole, the quantitative analysis results suggest that Co and Ni are preferentially dissolved, which are in agreement with the results of the EDS point analysis in Table 4. The content of Fe does not reduce obviously for Cr0, Cr0.6 and Cr1, except for Cr1.5, showing that the selective dissolution of Fe is more difficult than Co and Ni. It also demonstrates that Cr oxide (Cr2O3) and hydroxide (Cr(OH)3) are indeed generated on the surfaces of Cr-containing HEAs in the nominal Cr concentration of ~13.0 at.% at least, which is close to the threshold in conventional stainless steels[12].
In order to clarify the honeycomb-like structure of the surface, the cross-sectional microstructure of a typical corrosion micropore located on the surface of Cr1 was characterized by TEM in detail, as shown in Figure 8. The depth of the micropore is ~200 nm, in line with the result of the AFM height image in Figure 6. Furthermore, the selected cross-section can clearly be divided into two regions. The top region above the interface (the dotted line in Figure 8A) is referred to as the oxide film inside the micropore, while the region below the interface is the un-corroded matrix. High-resolution TEM image [Figure 8A] along with fast Fourier transform (FFT) patterns [Figure 8B and C] reveals that the oxide film consists of both amorphous and nanocrystalline (Cr, Mn)Ox. The boundaries between the nanocrystalline and the amorphous phases are considered to provide tunnels for species diffusion and transport, where the corrosive ions permeate preferentially, similar to the mechanism that the Cl- ion attacks on the oxide film of the metals[32]. It might be induced by the detrimental effect of Mn, which could be concentrated in the oxide film to greatly affect the occurrence of the nanocrystalline phase. The EDS elemental maps [Figure 8E] indicate that the oxide film is rich in Mn, Cr and O, but deficient in Fe, Co and Ni.
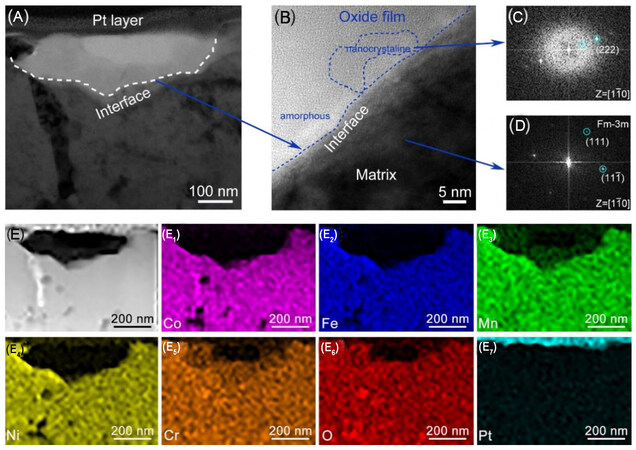
Figure 8. TEM characterization of a typical corrosion micropore on the surface of Cr1 HEA. (A) Bright-field TEM image; (B-D) are the high-resolution TEM image obtained from the interface region and the corresponding FFT patterns, respectively; and (E-E7) HAADF-STEM image with the corresponding EDS elemental maps. TEM: Transmission electron microscopy; HEA: high-entropy alloy; FFT: fast fourier transform; HAADF-STEM: high-angle annular dark-field scanning TEM; EDS: energy-dispersive X-ray spectroscopy.
EIS
To understand the corrosion mechanism of CrxMnFeCoNi HEAs in the 0.5 M H2SO4 solution, the EIS measurements under OCP conditions were conducted and analyzed in Figure 9. In terms of the Nyquist plots [Figure 9A], all HEAs have similar features where a depressed capacitive semicircle covers high frequency region and some scattered points are distributed randomly near the real axis in the low frequency region. The diameter of the capacitive semicircle first decreases from Cr0 to Cr0.6 and then increases to Cr1.5, indicating the same trend for the corrosion resistance[22,33]. It is found that only one time constant is presented in the high frequency of each Bode plot [Figure 9B], indicating the corrosion behavior of the passive film. With the decrease of the frequency, the phase angle reduces. The capacitance for the passive film increases and the corrosion resistance decreases, suggesting that the etching solution gradually sinks into the passive film. Moreover, in the wide range of the low frequency region, the phase angles are all approximately 0° and the values of |Z| are constant, which are characteristic of the pure resistance, indicating that the passive films on the HEAs are not very compact. Likewise, the value of |Z| at a fixed frequency of 0.1 Hz is usually equal to the polarization resistance related to the corrosion resistance[34]. Therefore, the corrosion resistance follows the order of Cr1.5 > Cr0 > Cr1 > Cr0.6. On the other hand, there is no straight line representing the diffusion process or another capacitive semicircle corresponding pitting behavior present in the Nyquist plot, which is due to the simultaneous formation of the passive film at the corroded region when the etching solution reaches the matrix [Figure 6].
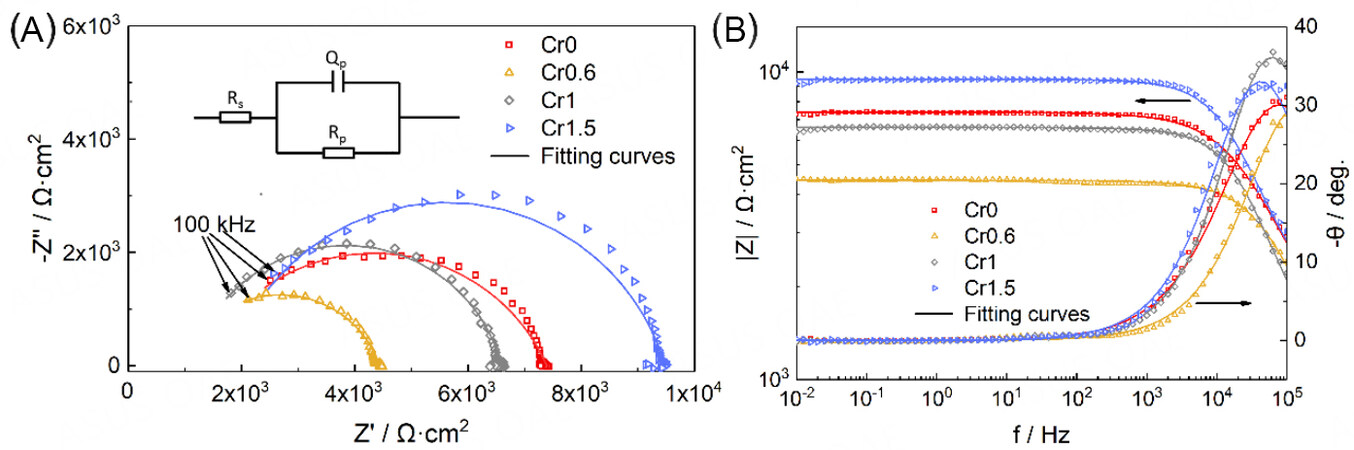
Figure 9. Nyquist (A) and Bode plots (B) of the CrxMnFeCoNi (x = 0, 0.6, 1, and 1.5) HEAs in a 0.5 M H2SO4 solution under open circuit potential condition. The inset in (A) is the electrical equivalent circuit (EEC) for fitting the EIS results. HEAs: High-entropy alloys; EIS: electrochemical impendence spectroscope.
In order to fit the results of the EIS under the OCP condition, an electrical equivalent circuit (EEC) model (inset in Figure 9A) was used. In the EEC model, a parallel combination of a constant phase element Qp and a passivation layer resistance Rpcorresponding to one time constant is in series with a solution resistance Rs, which has good fitting reliability as the small chi-square values in the order of magnitudes of 10-4 listed in Table 3. Herein, the ideal capacitance Cpis replaced by the constant phase element Qpto compensate for the non-homogeneity and the capacity dispersion in the system[35], such as an uneven corroded surface. The Qp impendence ZQ is given as follows,
Where Yp is the proportionality factor, j is the imaginary unit, ω is the phase frequency, and n is the phase shift, reflecting the degree of the dispersion for an ideal capacitance. For np= 1, ZQ represents a pure capacitance with Cp= Yp; for np= 0.5, it presents a Warburg resistance; and for np= 0, it presents a pure resistance with Rp= Yp-1. As a result, np increases from Cr0 to Cr1, implying that the passive film becomes more compact on the surface. While from Cr1 to Cr1.5, np decreases slightly, which is ascribed to the discontinuous passive film containing the weak site in the deep micropore, as shown in Figure 6. Moreover, as the value of np is in the range of 0.74-0.84, which is close to 1, the value of Yp can be approximately regarded as capacitance Cp of the passive film. Considering the Helmholtz model[21,36], the value of Yp is determined by the equation as follows,
where d is the thickness of the passive film, S is the exposed surface area, ε0 is the permittivity of the vacuum, and ε is the dielectric constant of the surface which is mainly determined by the composition of the passive film. Therefore, the decrease of the value of Yp from Cr0 to Cr1 and then the increase from Cr 1 to Cr1.5 can be affected by two factors for all samples: the change of the composition and the thickness of the passive film. Meanwhile, as Cr0.6 and Cr1 have a similar surface composition as analyzed by XPS [Figure 7], the larger Yp of Cr1 is mainly induced by the thicker passive film than Cr0.6. Notably, the decreased Yp for Cr1.5 should be mainly attributed to the change of the composition rather than the reduced thickness of the passive film. In terms of the resistance Rp, which reflects the corrosion resistance area of the passive film and the electron migration rate at the sample’s surface/electrolyte interface, the smaller value of Rp indicates the lower corrosion resistance. Based on this, the corrosion resistance for the four groups of HEAs first decreases and then increases with the increasing concentration of Cr, in line with the results of the polarization tests.
Long-time immersion
Figure 10 shows the surface morphology and average corrosion rate of CrxMnFeCoNi HEAs after immersion in a 0.5 M H2SO4 solution for 15 days at room temperature. The distribution of the micropores on the surface has no difference from that after polarization tests, but the micropores are much larger and the surfaces become looser. The formation of a more honeycomb-like corrosion surface, especially for Cr1.5, suggests that the HEAs suffered from more severe corrosion during the immersion of the 15 days, due to the absence of the long-term stable passive film. Likewise, the average corrosion rate [Figure 10E] increases exponentially with the Cr concentration. The Cr1.5 HEA shows the highest corrosion rate, 6 times higher than that of Cr1, which seems in contradiction with the results of the electrochemical tests. The significant change in the corrosion behavior during the long-time immersion between the four groups of HEAs could be attributed to the transformed corrosion mechanism. The dominant galvanic corrosion behavior has a direct correlation with the Cr concentration, which would be discussed in detail later.
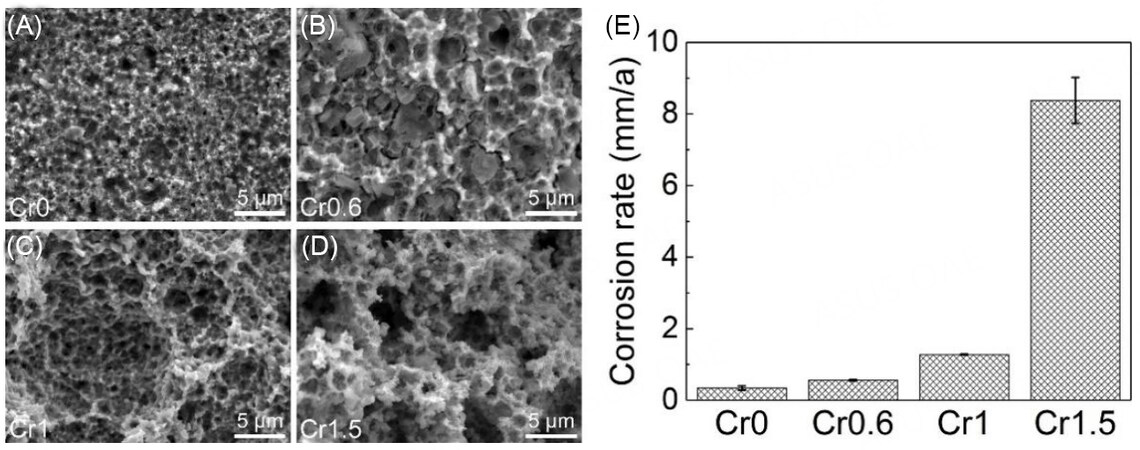
Figure 10. Surface morphology (A-D) and the average corrosion rate (E) by mass loss of the CrxMnFeCoNi (x = 0, 0.6, 1, and 1.5) HEAs after immersion in a 0.5 M H2SO4 solution for 15 days at room temperature. HEAs: high-entropy alloys.
DISCUSSION
Honeycomb-like morphology after polarization tests
Interestingly, all samples show the honeycomb-like morphology after polarization tests, as shown in Figure 6, which means that the corroded micropores were uniformly distributed on the surfaces of
With the single fcc phase, the grain boundary has a dominant effect on the corrosion behavior for Cr0, which can act as a defect zone[37,38] and the galvanic corrosion between the grain boundary and the intragranular zone can occur during the corrosion process. Moreover, the grain size of Cr0 is ~ 300 nm, which is close to the diameters of micropores after the polarization tests in Figure 6A. Thus, it is confirmed that the intragranular zone as the anode for Cr0 was preferentially corroded and the grain boundary as the cathode acted as the corrosion barrier at the early stage in H2SO4 solution, so that many small micropores were generated on the surface. However, for Cr0.6, Cr1 and Cr1.5, the Cr-rich phase such as (Cr, Mn)3O4 dissolved out from the matrix, causing a greater impact than the grain boundary on the corrosion behavior. Meanwhile, the corrosion for the Cr-containing HEAs occurred mainly around the (Cr, Mn)3O4 phase zone and the galvanic corrosion mainly occurred between the second phases and the matrix. With more segregation of the Cr and the increase of the average size of the Cr-rich zone at higher Cr concentration [Figure 1], the galvanic corrosion effect would become stronger as the increasing area ratio of cathode to anode, resulting in the larger and more dispersed micropores in the honey-like morphology [Figure 6]. The depth of the micropores was mainly increased by the galvanic corrosion effect and restrained by the protective effect of the passive film. As more severe galvanic corrosion present in Cr1.5, also indicated by the value of Ecorr, much deeper micropores were formed on the surface than the other HEAs. The smallest depth of the micropores of Cr1 should be mainly attributed to its dense passive film that has not been damaged by the insufficient galvanic effect at this stage. Moreover, the tiny height fluctuation in or out of the micropores was observed in Figure 6, which may be caused by the galvanic effect between the matrix and the heterogeneous nanoscale particles, such as the (Cr, Mn)-rich phase shown in Figure 4.
Corrosion process during the polarization tests
It is found that when the four groups of HEAs were corroded in the 0.5 M H2SO4 solution, the selective dissolution proceeded and the element Co, Ni and Fe were preferentially released from the matrix, which may be attributed to the dissolution rate difference of the constituent elements in these HEAs in the corrosion environment[7,39]. The hydroxides of Cr, Mn and Fe were deposited on the surface of the HEAs by the hydrolysis reactions at the same time, then some hydroxides formed early in the inner layer may dehydrate to form the oxides[40,41], such as Cr2O3. Therefore, the complete passive films were formed. The major chemical reactions present in the above corrosion process are shown as follows:
Anodic reaction: M → Mn+ + ne- (M: constituent metal element of the HEAs)
Cathodic reaction: 2H+ + 2e- → H2
O2 + 2H2O + 4e- → 4OH-
Hydrolysis reaction: Mn+ + nH2O → M(OH)n + nH+
Figure 11 shows the schematic diagrams of the corrosion process for these four groups of HEAs during polarization in the 0.5 M H2SO4 solution. As discussed above, the intragranular zone near the grain boundary of Cr0 starts to corrode preferentially as the galvanic corrosion effect. With the selective dissolution proceeding, the corroded zone gradually turns into the Mn-rich zone at noble potential, and then the corrosion spreads from the nearest zone to the grain boundary into the grain interior. As the gradually increased area ratio of cathode to anode, the central zone suffers from more severe corrosion than the zone adjacent to grain boundary and the micropores are formed on the surface. Additionally, as described in Figure 11A, more metal ions would be released into the solution than the uncorroded zone by the redox reaction. This would facilitate the hydrolysis reaction to form stable metal hydroxide/oxide, such as Fe and Mn hydroxide/oxide, on the corroded zone, which can retard the corrosion process effectively. Meanwhile, when a small amount of Cr was added in Cr0.6, as shown in Figure 11B, the second phase of (Cr, Mn)3O4 would precipitate from the matrix, and the corrosion process then occurred near the second phase zone. As the grain boundary can be regarded as the corrosion barrier[38], the corrosion process could end up in the grain boundary zone far away. Notably, such a corrosion process may have two routes: one is that the corrosion propagates along one direction, as the passive film in other directions is more compact; the other one is that the corrosion propagates around the second phase so that the second phase particles would locate in the micropores and peel off from the surface finally. Moreover, the passive film is not only formed in the corroded zone inside the micropores, but also out of the micropores as the slight corrosion by the effect of the nanoscale heterogeneous composition. In terms of Cr1 in Figure 11C, the alloy has the same corrosion mechanism as Cr0.6 except for the microstructure of the passive film. That is, Cr1 has a more compact and thicker passive film than Cr0.6 to provide effective protection to the matrix. However, the micropores for Cr1.5 are much larger and deeper than Cr1 and a few hydroxides/oxides are deposited in the micropores, as shown in Figure 11D. The larger micropores should be due to the larger second phase in the matrix, which would accelerate the corrosion in the local regions without enough protection from the passive film. It can be explained as follows: the dissolution rate of the anode in the micropores is so fast due to the strong galvanic effect that the concentrations of the metal ions are very high; when the diffusion rate of metal cations out of the micropore is much lower than the anodic dissolution rate in the activated region, the concentrations of the metal ions in the micropores could be maintained above a critical value, then the pH value decreases in the local regions by the excessive hydrolysis reactions, and thus causing a more aggressive environment[42,43], which not only restrains the formation of the stable passive film in the micropores, but also induces the formation of the additional (Mn, Cr)-rich layer on the inner surface. In contrast, compared with Cr1, in the larger region outside the micropores of Cr1.5, the more compact and flat passive film following the same passivation mechanism without dissolution process is generated based on the results shown in Figures 6 and 7, which has more effective protection against the matrix, resulting in the lower corrosion rate for Cr1.5 during the polarization tests.
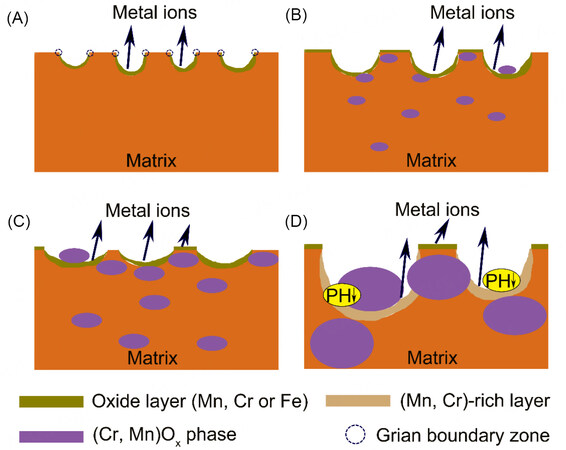
Figure 11. The schematic diagrams of the corrosion process during the polarization tests in 0.5 M H2SO4 for Cr0 (A), Cr0.6 (B), Cr1 (C) and Cr1.5 (D).
Corrosion process during the long-time immersion tests
It is interesting to find that when the HEAs were immersed in the 0.5 M H2SO4 solution at room temperature for 15 days, the corrosion rates increased quickly with the Cr concentration, which seems in contradiction with the results of the polarization tests. This contradiction can mainly be attributed to the competition mechanism between the passivation effect and the galvanic corrosion effect on the honeycomb-like surface. At the early period of the immersion tests, the corrosion behavior can be regarded as the same with the polarization tests[44] and the EIS measurement after 2 h of immersion, as the EIS measurement is at a quasi-stable state and does not change the condition of the corroded surface, when the passivation effect plays an important role in the corrosion process for the samples. Therefore, with the addition of Cr, the stable Cr hydroxide/oxide would be deposited more on the surface, so that the passive film is more compact and thicker. As a result, Cr1.5 has the best corrosion resistance. With the extending time for Cr0, Cr0.6 and Cr1, the etching solution would gradually permeate the passive films in the micropores as the passive films are not very compact and stable. Meanwhile, the composition of the corroded area would convert to the Mn-rich or the (Cr, Mn)-rich region, which increases the area of the cathode. In the end, the enhanced galvanic corrosion effect is strong enough as that of Cr1.5 to increase the depth of micropores so that the passive films in the inner surfaces of the micropores would be dissolved. At this stage, the galvanic corrosion effect for all samples gradually accumulates and starts to transcend the impact of the passivation effect. Subsequently, the micropores continue to grow and the samples are corroded more severely. During this period, pitting-like corrosion is considered to proceed on the honeycomb-like surface, which is also promoted by the loose surface film. Therefore, the galvanic corrosion effect would play a dominant role during the following immersion. As mentioned, the galvanic corrosion would get more severe with the increase of the Cr concentration; hence, Cr1.5 gradually has the highest corrosion rate during the long-time immersion tests. Moreover, the porous structure is also found inside or outside of the micropores of the samples in Figure 10, which evolved from the tiny height fluctuation during the initial period of the immersion, due to the intrinsic heterogeneous nanoscale particles.
In summary, the addition of Cr in CrxMnFeCoNi HEAs is indeed liable to form the Cr oxide in the passive film, which has good stability in the solution and improves the corrosion resistance of the HEAs[17,45]. On the other hand, the Cr can also precipitate from the matrix, which could accelerate corrosion by enhancing the galvanic corrosion effect. In addition, the formed honeycomb-like corroded surfaces on the HEAs would further deteriorate the corrosion resistance. Therefore, it is vital to optimize the matrix structure of the Cr-containing HEAs by changing the constituent elements as well as the processing methods to improve the corrosion resistance in future work. Generally, there are two methods to improve the corrosion resistance of the Cr-containing HEAs. One is to decrease or even eliminate the segregation of the Cr and homogenize the composition and the other is to optimize the structure and the composition of the passive film for high Cr-containing HEAs[46] and eliminate the nanocrystalline-amorphous phase boundaries.
CONCLUSION
The corrosion behavior of ultrafine-grained CrxMnFeCoNi HEAs with varying Cr contents in sulfuric acid solution (0.5 M H2SO4) was investigated. The Cr-containing HEAs consisted of an fcc matrix and a small amount of (Cr, Mn)3O4 at the grain boundaries and the (Cr, Mn)-rich phase due to the compositional segregation. During the polarization tests, the corrosion rate first increased and then decreased with the addition of Cr. The Cr1.5 HEA showed the lowest corrosion rate due to the effective passivation. The honeycomb-like surface was formed after electrochemical polarization tests. The passive film was mainly composed of (Mn, Fe) hydroxide/oxide for Cr0 and (Cr, Mn and Fe) hydroxide/oxide for the Cr-containing HEAs. The passive film was more compact and thicker with the increasing Cr concentration. However, the existence of the nanocrystalline-amorphous phase boundaries in the passive film could reduce its stability by providing the diffusion channel of the species. During the static long-time immersion tests, the HEAs showed distinct corrosion behavior from that of the polarization tests, where the corrosion rate increased exponentially from Cr0 to Cr1.5. This unexpected phenomenon should be due to the accumulation of the galvanic corrosion effect induced by the pitting-like corrosion accompanied by the failure of the passivation effect.
DECLARATIONS
Authors’ contributions
Conceptualization, methodology, validation, formal analysis, investigation, data curation, visualization, writing - original draft: Wan T
Methodology, investigation: Huang Z
Investigation: Cheng Z, Zhu M, Li Z, Fu D
Methodology, investigation: Zhu W
Conceptualization, methodology, formal analysis, resources, data curation, visualization, writing - review & editing, supervision, project administration, funding acquisition: Ren F
Availability of data and materials
The raw/processed data required to reproduce these findings are available upon request to the corresponding author.
Financial support and sponsorship
This work was financially supported by the National Natural Science Foundation of China (No. 52122102), the Shenzhen Peacock Team Program (No. KQTD2016053019134356) and the Guangdong Innovative & Entrepreneurial Research Team Program (No. 2016ZT06C279).
Conflicts of interest
All authors declared that there are no conflicts of interest.
Ethical approval and consent to participate
Not applicable.
Consent for publication
Not applicable.
Copyright
© The Author(s) 2023.
Supplementary Materials
REFERENCES
1. George E, Curtin W, Tasan C. High entropy alloys: a focused review of mechanical properties and deformation mechanisms. Acta Mater 2020;188:435-74.
2. Otto F, Dlouhý A, Somsen C, Bei H, Eggeler G, George E. The influences of temperature and microstructure on the tensile properties of a CoCrFeMnNi high-entropy alloy. Acta Mater 2013;61:5743-55.
3. Zhang Z, Mao MM, Wang J, et al. Nanoscale origins of the damage tolerance of the high-entropy alloy CrMnFeCoNi. Nat Commun 2015;6:10143.
4. Chuang M, Tsai M, Wang W, Lin S, Yeh J. Microstructure and wear behavior of AlxCo1.5CrFeNi1.5Tiy high-entropy alloys. Acta Mater 2011;59:6308-17.
5. Granberg F, Nordlund K, Ullah MW, et al. Mechanism of radiation damage reduction in equiatomic multicomponent single phase alloys. Phys Rev Lett 2016;116:135504.
6. Shi Y, Collins L, Feng R, et al. Homogenization of Al CoCrFeNi high-entropy alloys with improved corrosion resistance. Corros Sci 2018;133:120-31.
7. Chen Y, Duval T, Hung U, Yeh J, Shih H. Microstructure and electrochemical properties of high entropy alloys-a comparison with type-304 stainless steel. Corros Sci 2005;47:2257-79.
8. Miracle D, Miller J, Senkov O, Woodward C, Uchic M, Tiley J. Exploration and development of high entropy alloys for structural applications. Entropy 2014;16:494-525.
9. Cantor B, Chang I, Knight P, Vincent A. Microstructural development in equiatomic multicomponent alloys. Mater Sci Eng A 2004;375-377:213-8.
10. Gludovatz B, Hohenwarter A, Catoor D, Chang EH, George EP, Ritchie RO. A fracture-resistant high-entropy alloy for cryogenic applications. Science 2014;345:1153-8.
11. Sun S, Tian Y, Lin H, et al. Temperature dependence of the Hall-Petch relationship in CoCrFeMnNi high-entropy alloy. J Alloy Compd 2019;806:992-8.
12. Sieradzki K, Newman RC. A percolation model for passivation in stainless steels. J Electrochem Soc 1986;133:1979-80.
13. Yuan S, Liang B, Zhao Y, Pehkonen S. Surface chemistry and corrosion behaviour of 304 stainless steel in simulated seawater containing inorganic sulphide and sulphate-reducing bacteria. Corros Sci 2013;74:353-66.
14. Tan L, Ren X, Sridharan K, Allen T. Corrosion behavior of Ni-base alloys for advanced high temperature water-cooled nuclear plants. Corros Sci 2008;50:3056-62.
15. Thomas S, Birbilis N, Venkatraman M, Cole I. Self-repairing oxides to protect zinc: review, discussion and prospects. Corros Sci 2013;69:11-22.
16. Qiu Y, Thomas S, Gibson MA, Fraser HL, Birbilis N. Corrosion of high entropy alloys. NPJ Mater Degrad 2017;1:15.
17. Xiao D, Zhou P, Wu W, et al. Microstructure, mechanical and corrosion behaviors of AlCoCuFeNi-(Cr,Ti) high entropy alloys. Mater Des 2017;116:438-47.
18. Wang R, Zhang K, Davies C, Wu X. Evolution of microstructure, mechanical and corrosion properties of AlCoCrFeNi high-entropy alloy prepared by direct laser fabrication. J Alloy Compd 2017;694:971-81.
19. Li QH, Yue TM, Guo ZN, Lin X. Microstructure and corrosion properties of AlCoCrFeNi high entropy alloy coatings deposited on AISI 1045 steel by the electrospark process. Metall Mater Trans A 2013;44:1767-78.
20. Hsu Y, Chiang W, Wu J. Corrosion behavior of FeCoNiCrCux high-entropy alloys in 3.5% sodium chloride solution. Mater Chem Phys 2005;92:112-7.
21. Ye Q, Feng K, Li Z, et al. Microstructure and corrosion properties of CrMnFeCoNi high entropy alloy coating. Appl Surf Sci 2017;396:1420-6.
22. Luo H, Li Z, Mingers AM, Raabe D. Corrosion behavior of an equiatomic CoCrFeMnNi high-entropy alloy compared with 304 stainless steel in sulfuric acid solution. Corros Sci 2018;134:131-9.
23. Wang C, Yu J, Yu Y, Zhao Y, Zhang Y, Han X. Comparison of the corrosion and passivity behavior between CrMnFeCoNi and CrFeCoNi coatings prepared by argon arc cladding. J Mater Res Technol 2020;9:8482-96.
24. Wang C, Yu Y, Yu J, Zhang Y, Wang F, Li H. Effect of the macro-segregation on corrosion behavior of CrMnFeCoNi coating prepared by arc cladding. J Alloy Compd 2020;846:156263.
25. Wang L, Mercier D, Zanna S, et al. Study of the surface oxides and corrosion behaviour of an equiatomic CoCrFeMnNi high entropy alloy by XPS and ToF-SIMS. Corros Sci 2020;167:108507.
26. Pang J, Xiong T, Wei X, et al. Oxide MnCr2O4 induced pitting corrosion in high entropy alloy CrMnFeCoNi. Materialia 2019;6:100275.
27. Li S, Dong H, Shi L, Li P, Ye F. Corrosion behavior and mechanical properties of Al-Zn-Mg aluminum alloy weld. Corros Sci 2017;123:243-55.
28. Zhang X. Corrosion behavior of Al-3.0 wt.%Mg alloy by cold-drawing process. Int J Electrochem Sci 2020:1727-41.
29. Soltis J. Passivity breakdown, pit initiation and propagation of pits in metallic materials - review. Corros Sci 2015;90:5-22.
30. Yan Y, Cao H, Kang Y, et al. Effects of Zn concentration and heat treatment on the microstructure, mechanical properties and corrosion behavior of as-extruded Mg-Zn alloys produced by powder metallurgy. J Alloy Compd 2017;693:1277-89.
31. Park K, Kwon H. Effects of Mn on the localized corrosion behavior of Fe-18Cr alloys. Electrochim Acta 2010;55:3421-7.
32. Zhang B, Wang J, Wu B, et al. Unmasking chloride attack on the passive film of metals. Nat Commun 2018;9:2559.
33. Sun J, Zhang G, Liu W, Lu M. The formation mechanism of corrosion scale and electrochemical characteristic of low alloy steel in carbon dioxide-saturated solution. Corros Sci 2012;57:131-8.
34. Rovere C, Alano J, Silva R, Nascente P, Otubo J, Kuri S. Characterization of passive films on shape memory stainless steels. Corros Sci 2012;57:154-61.
35. Barsoukov E, Macdonald JR. Impedance spectroscopy: theory, experiment, and applications second edition. Evgenij Barsoukov and J. Ross Macdonald (eds). John Wiley & Sons, Inc., Hoboken, New Jersey, 2005. J Raman Spectrosc 2007;38:122.
36. Kissi M, Bouklah M, Hammouti B, Benkaddour M. Establishment of equivalent circuits from electrochemical impedance spectroscopy study of corrosion inhibition of steel by pyrazine in sulphuric acidic solution. Appl Surf Sci 2006;252:4190-7.
37. Tachibana S, Kuronuma Y, Yokota T, Yamada K, Moriya Y, Kami C. Effect of hot rolling and cooling conditions on intergranular corrosion behavior in Alloy625 clad steel. Corros Sci 2015;99:125-33.
38. Aung NN, Zhou W. Effect of grain size and twins on corrosion behaviour of AZ31B magnesium alloy. Corros Sci 2010;52:589-94.
39. Kao Y, Lee T, Chen S, Chang Y. Electrochemical passive properties of AlxCoCrFeNi (x = 0, 0.25, 0.50, 1.00) alloys in sulfuric acids. Corros Sci 2010;52:1026-34.
40. Boudin S, Vignes J, Lorang G, et al. Analytical and electrochemical study of passive films formed on nickel-chromium alloys: influence of the chromium bulk concentration. Surf Interface Anal 1994;22:462-6.
41. Huang J, Wu X, Han E. Electrochemical properties and growth mechanism of passive films on Alloy 690 in high-temperature alkaline environments. Corros Sci 2010;52:3444-52.
42. Li T, Scully JR, Frankel GS. Localized corrosion: passive film breakdown vs. pit growth stability: part iii. a unifying set of principal parameters and criteria for pit stabilization and salt film formation. J Electrochem Soc 2018;165:C762-70.
43. Li T, Swanson OJ, Frankel G, et al. Localized corrosion behavior of a single-phase non-equimolar high entropy alloy. Electrochim Acta 2019;306:71-84.
44. Shi Z, Liu M, Atrens A. Measurement of the corrosion rate of magnesium alloys using Tafel extrapolation. Corros Sci 2010;52:579-88.
45. Asami K, Hashimoto K, Shimodaira S. An XPS study of the passivity of a series of iron-chromium alloys in sulphuric acid. Corros Sci 1978;18:151-60.
Cite This Article
Export citation file: BibTeX | RIS
OAE Style
Wan T, Huang Z, Cheng Z, Zhu M, Zhu W, Li Z, Fu D, Ren F. The effect of chromium content on the corrosion behavior of ultrafine-grained CrxMnFeCoNi high-entropy alloys in sulfuric acid solution. Microstructures 2023;3:2023014. http://dx.doi.org/10.20517/microstructures.2022.36
AMA Style
Wan T, Huang Z, Cheng Z, Zhu M, Zhu W, Li Z, Fu D, Ren F. The effect of chromium content on the corrosion behavior of ultrafine-grained CrxMnFeCoNi high-entropy alloys in sulfuric acid solution. Microstructures. 2023; 3(2): 2023014. http://dx.doi.org/10.20517/microstructures.2022.36
Chicago/Turabian Style
Wan, Tian, Zhikun Huang, Zhuo Cheng, Mingyu Zhu, Weiwei Zhu, Zongyuan Li, Danni Fu, Fuzeng Ren. 2023. "The effect of chromium content on the corrosion behavior of ultrafine-grained CrxMnFeCoNi high-entropy alloys in sulfuric acid solution" Microstructures. 3, no.2: 2023014. http://dx.doi.org/10.20517/microstructures.2022.36
ACS Style
Wan, T.; Huang Z.; Cheng Z.; Zhu M.; Zhu W.; Li Z.; Fu D.; Ren F. The effect of chromium content on the corrosion behavior of ultrafine-grained CrxMnFeCoNi high-entropy alloys in sulfuric acid solution. Microstructures. 2023, 3, 2023014. http://dx.doi.org/10.20517/microstructures.2022.36
About This Article
Copyright

Data & Comments
Data
0

 Cite This Article 15 clicks

 Like This Article 33
likes
Like This Article 33
likes


Comments
Comments must be written in English. Spam, offensive content, impersonation, and private information will not be permitted. If any comment is reported and identified as inappropriate content by OAE staff, the comment will be removed without notice. If you have any queries or need any help, please contact us at support@oaepublish.com.